≡ Menu

JEE

One important change in Memory Management in Java 8

Oracle’s latest edition for Java – Java 8 was released in March 2014. As usual, tons of new features have been added. There is one major change in the Memory management area that I want to discuss today.

“So long PermGen, Hello Metaspace !!”

Oracle has completely gotten rid of ‘PermGen’ and replaced it with Metaspace.

What is PermGen ?

Read More

So, when was the last time you monitored the CPU utilized by your Java application ? Perhaps ‘never’ ?. It is actually important to keep an eye on the CPU utilzied by your application. Your Application runs on a host (or hosts) that has one or more CPUs managed by the Operating System. The CPU resource is not unlimited (even though some developers and Administrators wish that were true).

Let’s dive into the 4 things you need to know about the CPU Utilization of your Java application.

1. Why do you care ?

Read More

Top 4 Java Heap related issues and how to fix them

Java heap related issues can cause severe damage to your application that will directly result in poor end user experience. Care must be taken to tune the Heap related parameters that suit your application. Out of the box default parameters are not enough.

Quick overview:

Java Heap is the memory used by your application to create and store objects. You define the maximum memory that can be for the Heap by specifying ‘-Xmx<size>’ java command line option (Example: ‘-Xmx1024m‘, where m stands for Mega bytes). As your application runs, it will gradually fill up Heap. JVM periodically runs a process called ‘Garbage collection’ (GC) which will scan the heap and clear objects that are no longer referenced by your application.One cannot request Garbage Collection on demand. Only JVM can decide when to run GC.

Let me walk you through four of the most common Java Heap related issues and how to fix them.

Read More

When the user cannot access your web application and instead sees a generic (and ugly) ‘Page cannot be displayed’, the root cause could range from simple typo in the URL to having exhausted the Thread Pool in the Application Web Container. The key to resolving this type of problem is asking the right questions well in the beginning of troubleshooting.

pagecannotbedisplayed

Pull up your sleeves, here are the top 8 reasons for this problem.

Read More

Let’s face it. No matter how much tuning one can do at various sub systems (Application Server, Web Server, Operating System, Database), when the code is bad, you are screwed. Poor coding can cost a company a lot, and in some cases can cost the company itself.

Before diving into the 9 blunders made by the development team, let me tell you that I have been a software engineer and I have personally made lot of these mistakes myself. It requires great deal of discipline to be vigilant about writing quality code. There is no other choice.

Without further due, here are the 9 blunders by the Development team that will make Production Support’s life miserable. Don’t make anyone’s life miserable.

Read More

Are you on top of monitoring one of the most important metrics in your Java application ? I’m talking about Java Heap usage. If you think you don’t have to monitor the heap usage, think again.

“OutOfMemory” error is one of the deadliest and not keeping track of your heap usage means you are walking on a land mine – It can blow up all of a sudden.

Now that you know the importance of monitoring the Heap usage, how do you proceed ?

First of all, I would like to clarify one important thing.

Read More

5 Metrics you MUST monitor in your Java Application

I always get asked this question by my clients: What exactly do I need to monitor in my application, when it comes to performance and availability ?

file000237081085

Thanks (?!) to technologies like byte code instrumentation and JMX, you can literally have hundreds of thousands of Metrics coming from a single Java application. One can easily get overwhelmed by the amount of information that you can capture from a running JVM. The fact of the matter is, you don’t need to monitor the hundreds of thousands of metrics.

Read More

You can greatly increase your productivity and efficiency as a Middleware Administrator when you master just a very few critical Unix/Linux commands.

Here are 10 awesome Unix/Linux commands you should master if your infrastructure is unix based.

1. ps -ef

How can this command help me ?

“ps -ef” shows *all* the processes running on your System. It shows good information such as process id, the user running the program, the command line being used to run the program etc. When coupled with grep (ps -ef | grep <my application>), this command can instantly show you whether your application is alive or not.

Example:

karun.subramanian>ps -ef | grep bash

karun.su 5956 9796 pty0 14:06:32 /usr/bin/bash

karun.su 5740 5956 pty0 14:30:49 /usr/bin/bash

karun.subramanian>

 2. netstat

How can this command help me ?

netstat shows information about the network sockets. It can be extremely useful as it can instantly show the network activity of your application server.

Example:

netstat -an

-a: Displays all connections and listen ports

-n: Displays numerical IP instead of host names (without this flag, the server will try to resolve the IP to host name and this can be slow)

One powerful option is “-p” where the output will show the process id associated with the socket. For example, if you want to find out which process is using port 8088, you would run the following command

netstat -anp | grep 8088

3. df -k

How can this command help me ?

Shows all the File Systems and their usage in Kilo Bytes. Useful when dealing with ‘File System’ capacity issues.

Example:

df -k

Note: Another useful command when dealing with disk space usage is ‘du‘. I regularly use the command “du -sk *” to find out which directories are reponsible for disk space utilization.

4. traceroute

How can this command help me ?

Shows the network path being taken to reach the given server. Can be useful to find out the network devices present enroute to the destination server.

Example:

traceroute <my host>

5. tcpdump

How can this command help me ?

Captures network packets for analysis. Can be handy to troubleshoot ssl handshake issues, connection resets or connection failure type issues. The output of this command can be analyzed using tools like Microsoft Network Monitor or Wireshark

Example:

tcpdump host <myserver> -w <output file>

6. vmstat

How can this command help me ?

There was a time where I could just glimpse the output of vmstat and tell what’s the problem with the system. vmstat (virtual memory statistics) shows critical Server performance info such as CPU runqueue, Memory pages scan rate, IO waits etc

Example:

vmstat 2 20

(Take vmstat at 2 seconds interval for 20 minutes.)

7. find

How can this command help me ?

Find is a powerful command to search File system for files/directories.

Example:

find .     – Displays all the files and directories from the current directory onwards (traverses sub directories)

find /mydir -name “*.dmp”     – Displays all the files and directories whose names end with “.mp” under /mydir

8. kill

How can this command help me ?

Terminates processes. For example, when the Application Server does not respond to the usual shutdown commands, you will have to terminate it forcefully and ‘kill’ is the command you would need.

Example:

kill -9 <process id>

-9 will forcefully terminate the process – it is ugly but sometimes you will have to do this.

9. top

How can this command help me ?

Extremely useful performance monitoring tool. ‘topas’ in IBM AIX. For example, if you want to find out if you are running out of CPU or Memory, you would launch top.

Example:

top

10. vi

How can this command help me ?

Either you love it or hate it. The truth is ‘vi’ is a very versatile text editor –  once you learn few basic things, and with some practice, vI will become second nature to you.

Examples:

vi

Esc i  – Start typing text

Esc k – Move cursor one line down

Esc j – Move cursor one line up

Esc l – Move cursor one character right

Esc h – Move cursor on character left

(Note: Esc key toggles between input mode and command mode)

Esc :wq  – Save and exit

Esc : q!  –  Exit without saving

There you have it. While Unix commands are numerous and their switches/options are countless, mastering just above commands will take you a long way.

To learn more about these commands, use the man page:

man <command>

Enjoy


How to enable ssl debugging in Java ?

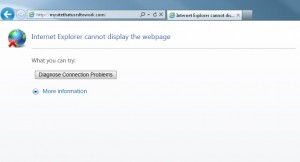
Dealing with SSL issues is no fun, especially when you have no debug logs and all you see is an ugly ‘Page Cannot be displayed’ in your browser.

Thankfully you can easily enable SSL debug on your Application to start seeing verbose logs that will clearly show the SSL handshake process. Here is how to do it:

Add the following JVM command line parameter and restart the Application Server:

-Djavax.net.debug=all

Note that since it is a Java System Property ( used by JSSE – Java Secure Sockets Extension), it will work on any JEE ApplicationServer such as WebSphere, WebLogic, Jboss, Tomcat etc.

How to do this in WebSphere ?

Depending on your WAS version, adding the above parameter is typically done by navigating to WAS Admin Console > Servers > Application Servers > YourServer > Process Management > Java Virtual Machine > Generic JVM arguments

The verbose logs will usually go to SystemOut.log

Note: If you are unable to update System Property via the java command line above for whatever reason, try OS level network packet monitoring tool first. Now what exactly are they? If you are running on Unix/Linux, try ‘snoop/tcpdump’. On windows, you are in luck – use Microsoft Network Monitor, a very powerful tool. You can also try wireshark (etheral) on Windows.

12 mostly used java command line options

Configuring the correct java command line options is primal for any Application Server. If you get it wrong, even slightly, the results can be devastating.

Here are the 12 mostly used java command line options. These are for Oracle Hotspot JVM version 7 and earlier.

Note: Options that begin with -X are non standard and not guaranteed to work in all flavors of VMs. And as per Oracle, options that begin with -XX are not stable. I say don’t worry too much about it. They are stable.

1. -Xms

The minimum size of the Heap. This is the memory that will be allocated when the JVM starts up.

Importance: When you set this too low, the JVM will need to expand the heap as required. Expansion can be an expensive process. When you set this too high, you might end up having more memory allocated than required. This means Garbage Collection (GC) is going to run longer as it needs to scan through larger heap.

Example: -Xms256m

2. -Xmx

The maximum size of the Heap. .

Importance: This is the ultimate ceiling on the heap and when this limit is breached, the infamous ‘OutOfMemory’ aka OOM is thrown. When this is too low, you may run into OOM error. When this is too high, the Garbage Collection (GC) is going run longer as it needs to scan through larger heap.

Example: -Xmx1024m

3. -client

Starts VM in client mode. Note that if your Java is 64bit, server VM is chosen by default even if you specify this option.

Importance: Client VM starts up quickly, but is not intended for running server applications.

4. -server

Starts VM in server mode. Note that if your Java is 64bit, server VM is chosen by default even if you specify this option.

Importance: Server VM starts up little bit slower compared to client VM, but is intended for running server applications.

5. -verbose:gc

Logs Verbose Garbage Collection info.

Importance: Can’t imagine how you cannot afford to have verbose GC enabled. It is an extremely low overhead logging and can be a life saver in case of OOM errors

6. -XX:+PrintGCDetails -XX:+PrintGCTimeStamps

Provides Detailed GC information along with Time stamps. Extremely useful.

Importance: Super useful when dealing with OOM.

7. -Xloggc:<GC log file name>

Logs Verbose GC to the specified file.

Importance: Useful to redirect the output to a particular file of your choice.

8. -XX:MaxPermSize=size

Specifies the Maximum Permanent generation size.

Importance: Perm Gen stores the class files (not objects). If you are using lot of third party tools such as APM agents etc, give at least 256 MB for perm gen. Otherwise OOM might occur.

Example: -XX:MaxPermSize=256m

9.-XX:NewRatio=<ratio>

Ratio of old/new generation Heap

Importance: This determines the generation sizes. A ratio of 2 means, old gen will get 2/3 of the heap and new gen would get 1/3 of the heap.

10. -XX:+UseG1GC

A new Garbage collector from Oracle – Garbage First Garbage collector. Attempts to clean up areas of heap that has the least amount of live objects

11. -XX:-UseConcMarkSweepGC

Uses the Garbage Collector Concurrent Mark and Sweep.

Importance: If you need to avoid longer pause times, go with this collector as it works along side the application (instead of pausing the application totally). On the other hand, if you don’t mind occasional long GC pauses but would rather have excellent throughput, go with -XX:-UseParallelGC

12. -javaagent:<jar>

Loads a java agent.

Importance: This is how you instrument you application with a third party agent. For example, Wily Introscope or AppDynamics Application Performance Management Agent.

There you have it. 12 mostly used Java command line options. For full reference, check out the following links:

http://docs.oracle.com/javase/7/docs/technotes/tools/windows/java.html

http://www.oracle.com/technetwork/java/javase/tech/vmoptions-jsp-140102.html