Are you on top of monitoring one of the most important metrics in your Java application ? I’m talking about Java Heap usage. If you think you don’t have to monitor the heap usage, think again.
“OutOfMemory” error is one of the deadliest and not keeping track of your heap usage means you are walking on a land mine – It can blow up all of a sudden.
Now that you know the importance of monitoring the Heap usage, how do you proceed ?
First of all, I would like to clarify one important thing.
The Memory utilization by the ‘process’ shown by operating system commands such as top (unix) or Task Manager (Windows) is NOT the java heap usage. What you see from Operating System perspective is the ‘process’ memory which ‘includes’ heap. We are not going to discuss about this metric.
What we are interested is the Heap size, which is limited by -Xmx command line option of the ‘java’ command. For example,
java -Xmx1024m
this means the java application can have maximum of 1024 Mega Bytes of Heap.
If you don’t know the maximum heap size for your application, check the command line of your java application to locate the -Xmx option.
There are quite a few ways you can capture the heap usage. Here are the 5 not so easy ways
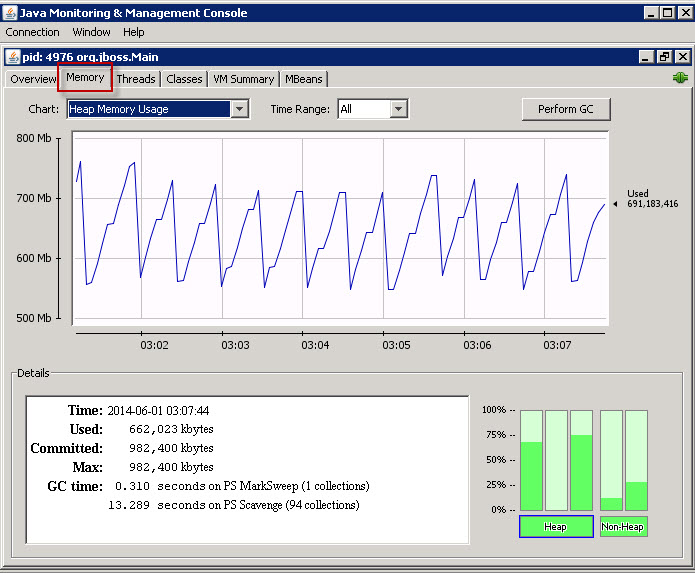
1. Use Jconsole
Jconsole is a GUI that can be used to monitor performance metrics of a java application. It attaches to a running Java application either locally or remotely (i.e. you can monitor a Java application that is running on the same system as Jconsole, or running on a remote system).
The command Jconsole is found in JDK_HOME/bin (this means you must have JDK installed, not just JRE (a typical scenario in production environments).
When running locally, all you need is the process id of the java application.
To invoke jconsole, just execute the following command. Example shown below is for Windows.
JDK_HOME/bin/jconsole.exe <PROCESS ID OF YOUR JAVA APPLICATION>
Important Note: You must have the correct access to the application in order for jconsole to connect to the running jvm. Typically, you must be the user who is running the java application as well as the jconsole command.

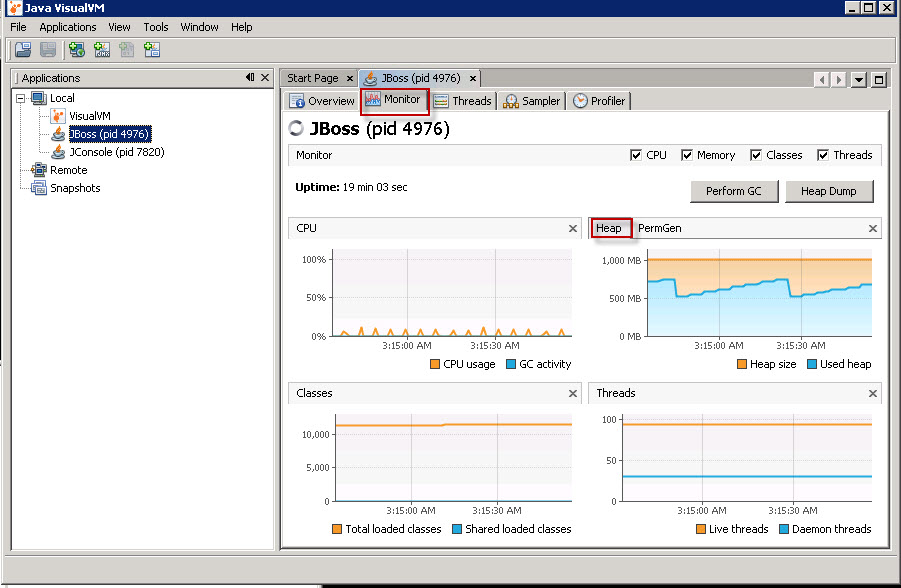
2. Use VisualVM
VisualVM is a relatively new tool that not only shows the performance metrics form the JVM but can be used to profile the application too.
Start visualvm by running the command
JDK_HOME/bin/jvisualvm.exe
Visual VM automatically finds the available java applications and shows them on the left pane. Either double click or ‘right click and select open’. You can see tons of useful information now
3. Use Jstat command
jstat command comes with JDK as well. Invoke the command as follows
JDK_HOME/bin/jstat.exe -gc <PROCESS ID OF YOUR JAVA APPLICATION>
Sample output:
S0C S1C S0U S1U EC EU OC OU PC PU YGC YGCT FGC FGCT GCT
22400 20736 224 0 306368 202917.9 699072 528814.9 74624 74552.1 112 13.496 1 0.311 13.807
Here is the description of the fields.
S0C Current survivor space 0 capacity (KB).
S1C Current survivor space 1 capacity (KB).
S0U Survivor space 0 utilization (KB).
S1U Survivor space 1 utilization (KB).
EC Current eden space capacity (KB).
EU Eden space utilization (KB).
OC Current old space capacity (KB).
OU Old space utilization (KB).
PC Current permanent space capacity (KB).
PU Permanent space utilization (KB).
YGC Number of young generation GC Events.
YGCT Young generation garbage collection time.
FGC Number of full GC events.
FGCT Full garbage collection time.
GCT Total garbage collection time.
When you add all the ‘utilizations’ i.e OU,PU,EU,S0U,S1U, you get the total Heap utilization.
4. Use -verbose:gc command line option
Add -verbose:gc command line option to the Java command and you will get detailed GC stats which will include Generational heap sizes before and after GC. You can also add the following options for Oracle HotSpot VM to get further information
-XX:+PrintGCDetails and -XX:+PrintGCTimeStamps
By analyzing the verbose GC output, you can determine the Heap usage. One small issue with this method is that you will get to see the metrics ONLY when a GC occurs (since a log entry is added ONLY when a GC occurs).
5. Use the JEE Application Server facilities.
If your application is a JEE application deployed on an application Server (such as IBM WebSphere or Oracle WebLogic), use the Admin console or JMX console (if available) to find out the heap usage. Method varies for each Application server. For example, with IBM WebSphere, you can use the Tivoli Performance Viewer that comes with the Admin Console to view performance metrics including the Heap usage. With JBoss, you can use the JMX console to grab the values for the MBean jboss.system:type=ServerInfo
I guess by now you know that all the above mentioned methods require some sort of effort to pull the information (trust me, when you try to have jconsole or visualvm connect to a remote Application, you would be thinking ‘why in the world this has to be this difficult ?’)
So, What is the easy way to monitor Heap usage ?
APM
The easy way to monitor Heap usage is by using a commercial APM (Application Performance management tool) such as CA Wily APM, AppDynamics,New Relic,Riverbed etc.
APM tools not only monitor the heap usage, you can configure the tool to Alert you when Heap usage is not normal. In this way, you can catch a production problem before it occurs. Better yet, APM tools have advanced capabilities to track the number of objects (a big aid in troubleshooting memory leak).
Once you have an APM solution deployed, you don’t ever have to worry about keeping track of the heap usage constantly.
Good luck
Hi Karun,
Thanks for the information. Whether we can monitor heap utilization from Appdynamics 3.9 version when G1GC is enabled?
Thanks and Regards
Saranya K
Hi, Saranya.
Absolutely. You should be able to monitor the Heap utilization regardless of the garbage collection algorithm being used.
Thanks
check out https://github.com/TeoGia/jotun
Its a simple program that outputs heap usage in json format