≡ Menu

APM

Splunk Search Modes: Fast vs. Smart vs. Verbose

If you are new to Spunk, you’ve probably seen the Search Mode option in the search interface, and wondering what in the world is Search Mode. Even some of the experienced Splunkers don’t fully understand the search modes. May be you run all of your searches in the verbose mode (not recommended), or may be all in fast mode (not recommended), or you want to play it nice and use smart mode (recommended, may be). By reading this blog post, you will fully understand what these search modes actually mean and thereby will be equipped to make the right choice. You can also find a video with demo at the end of this post. Let’s get started.

Search Modes

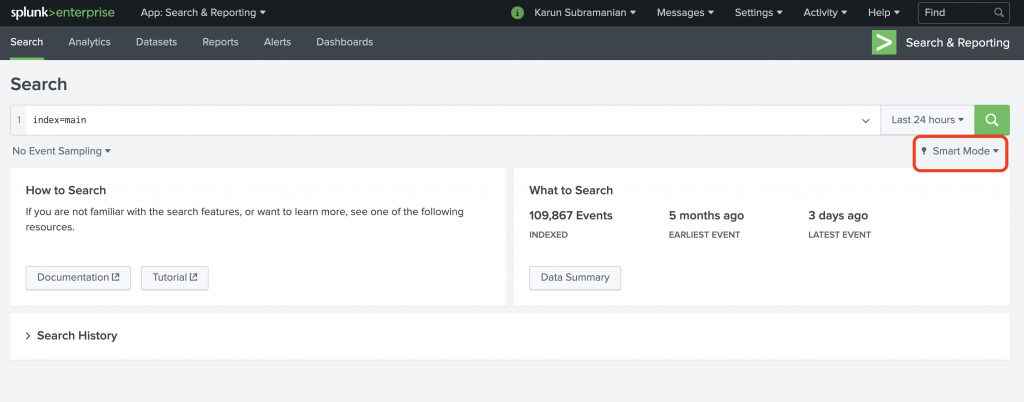
In Splunk search interface, the Search mode shows up right underneath the time picker. See figure 1.

Figure 1: Search Mode in Splunk search interface

When you click on the drop down arrow, you are provided with three options.

Read More

Splunk vs ELK

If you are in IT Operations in any role, you have probably come across either Splunk or ELK, or both. These are two heavyweights in the field of Operational Data Analytics. In this blog post, I’m going to share with you what I feel about these two excellent products based on my years of experience with them.

The problem Splunk and ELK are trying to solve: Log Management

While there are fancier terms such as Operational Data Intelligence, Operational Big Data Analytics and Log data analytics platform, the problem both Splunk and ELK are trying to solve is Log Management. So, what’s the challenge with Log management?

Logs, logs, logs and more logs


The single most important piece of troubleshooting data in any software program is the log generated by the program. If you have ever worked with vendor support for any software product, you have been inevitably asked to provide – you guessed it, Log files. Without the log files, they really can’t see what’s going on.

Logs not only contains information about how the software program runs, they may contain data that are valuable to business as well. Yeap, that’s right. For instance, you can retrieve wealth of data from your Web Server access logs to find out things like geographical dispersion of your customer base, most visited page in your website, etc.

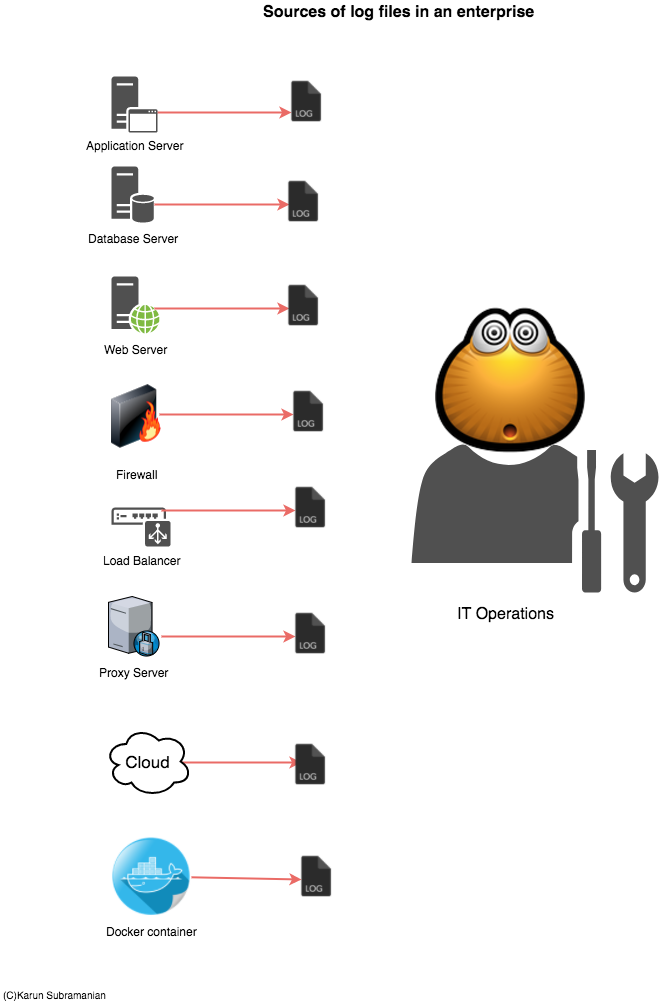
If you are running only a couple of servers with few applications running on them, accessing and managing your logs are not a problem. But in an enterprise with hundreds and even thousands of servers and applications, this becomes an issue. Specifically,

  1. There are thousands of log files.
  2. The size of these log files run in Giga or even Terra bytes.
  3. The data in these log files may not be readily readable or searchable (unstructured data)
Sources_of_logfiles (4)

Both Splunk and ELK attempt to solve the problem of managing ever growing Log data. In essence, they supply a scalable way to collect and index log files and provide a search interface to interact with the data. In addition, they provide a way to secure the data being collected and enable users to create visualizations such as reports, dashboards and even Alerts.

Now that you know the problem Splunk and ELK are attempting to solve, let’s compare them and find how they are achieving this. I’m going to compare them in 4 areas as follows:

Technology

Cost

Features

Learning Curve for the operations team

Got it ? I can’t wait to share. Let’s dive in.

Splunk_image

VS

ElasticSearch Logo

Read More

So we all know that Java Heap is a crucial resource, lack of which will kill your application. Naturally you will want to monitor the heap usage. Bur surprisingly it is not very straight forward to measure the heap usage of your JVM unless you have a modern APM (Application Performance Management) tool implemented. To make things worse, in Windows world, the memory you see in Windows Task Manager (a solid tool by btw) is NOT the same as the JVM heap size.

For example, let’s say you have set maximum java heap at 3GB. But it is quite possible that the memory shown by Task Manager be higher (much higher at times), say 3.5 gb or 4 gb. You can pull you hair trying to figure out where that extra memory utilization came from, or you can read rest of this article and put an end to the mystery.

Generally speaking, here is the reason memory shown by the Task Manager is more than the Heap: The memory shown in Task manager is the entire Memory footprint of the JVM and NOT just the Java Heap of the JVM. Note that the JVM is just an another process as far as Windows is concerned.

Read More

What you didn’t know about java.lang.OutOfMemory Error!

Few errors are deadlier than java.lang.OutOfMemory errors. When this happens, you application will run into a very unpredictable state, often hanging up and not processing new requests, coughing up ugly stack traces into users browsers etc. The most popular (and effective in the short run) fix for OutOfMemory error is simply restarting the Application or Application Server.

While running out of java Heap is the most common OutOfMemory error, there are indeed several types of OutOfMemory that can occur. In this post, I will show you these various types of OutOfMemory errors and what they mean.

java.lang.OutOfMemoryError: Java heap space

The most popular one. This is when JVM goes belly up and unable to allocate memory in Heap . Your application might appear hung up and extremely slow to respond to user requests.

For example, let’s say your Java application has 2GB of memory maximum (through -Xmx flag). When the entire 2GB is used up and GC is unable to reclaim any memory, the next memory allocation request for an object will fail with java.lang.OutOfMemory Error.

What causes java.lang.OutOfMemoryError: Java heap space ?

Read More

One important change in Memory Management in Java 9

Java 9 is supposed to be released in summer 2017. The biggest changes appear to be around modularization which enables  you to create, build, deploy and reuse modules of code. There is also the new jshell command line tool that lets you test snippets of code quickly. From Application support standpoint, I see one major change in memory management and that’s what I want to discuss today.

GC (Garbage Collection) is the bread and butter of Memory Management in java. GC  is responsible for cleaning up dead objects from memory and reclaiming that space. GC executes its cleanup using predefined Collectors that use certain algorithm(s). As I mentioned in my previous post, there are 4 Collectors that can be used.

  • Serial Collector
  • Parallel Collector
  • CMS (concurrent Mark and Sweep) Collector
  • G1 Collector

Until Java 1.8, on Server class machines (2 CPU and 2GB RAM minimum. Humor me if your server is leaner than this size), the default collector is Parallel collector.

Parallel collector is all about throughput. It does not care about having longer GC pause times (as it will stop the application threads before performing a GC). If you cannot tolerate long GC pause times (upwards of 1 second), you could choose CMS collector.

G1GC was introduced in Java 1.7 to address both increased throughput and decreased GC pause times overall.

Here is the major change with this edition of Java. G1GC is the default collector in Java 9.

Read More

In this post, I’m going to explain how Heap is organized using generations and how Garbage Collection works behind the scene to free up memory. Java memory management has evolved a lot over the past few java releases.  Understanding the mechanics underneath will help you better tune it (if required) to suit your needs.

When your java application runs, it creates objects which takes up memory space. As long the object is being used (i.e referred by the application somewhere), it is going to occupy the memory. When the object is no longer used (for example, when you cleanly close a DB connection), the space occupied by the object can be reclaimed by Garbage collection.

What are generations ?

Java heap is typically divided into two major pools. An area where short-lived objects live. And an area where long-lived objects live. Young generation (aka Nursery aka Eden) is the place for short-lived objects and Tenured generation (aka Old) is the place for long-lived objects.

Screen Shot 2017-05-23 at 7.20.32 PM

Why Generations ?

Read More

How to monior Heap usage of a Java Application ?

Heap is the memory space where java application objects are stored. Unfortunately the size of Heap is limited (by the -Xmx java command line option). When all of heap is used up, you are in deep trouble. So, it helps to understand how to measure Java heap usage, and that’s exactly what I’m going to be discussing with you in this post.

Very surprisingly, measuring heap is not that straight forward in java world. I believe it is due to the fact there are numerous ways to measure java heap. Oracle seems to introduce new tools with every release (and retire the old ones). For this reason, I recommend everyone to invest in a commercial grade APM (Application Performance Management) tool. With APM tool, you will simply login to the APM interface (typically a web application) to view the JVM heap usage (along with tons of other useful metrics)

Using the command jcmd to measure heap usage

Java comes with a command line tool named jcmd. It should be available in most flavors of Java (Oracle, IBM etc). I’m going to recommend jcmd to measure your heap usage. One of the advantages of using jcmd is the class histogram which not only shows the heap usage but it breaks down the usage by class. This gives you an instant view of what is causing heap to fill up.

Important Note: jcmd does have some impact on the jvm. But I assure it is worth the price, as the details shown by jcmd are very valuable.

Important Note: the command jcmd must be run as the same user (or effective user) as the user running the java application

Let us see jcmd in action.

Read More

By default, AppDynamics captures tons of useful metrics from your java application. Average response time of your Applications, JDBC response times, Throughput, Heap and Garbage Collection Metrics etc. In addition, AppDynamics automatically captures  Transaction Snapshots (that provide deep diagnostics) periodically and during slow response times. The snapshots will reveal the hotspots up to the method level.

But at times, you may want to monitor a particular method for performance metrics. For example, you may want to know how often a method named ‘cancelOrder’ is called and how long it takes to process. For requirements like this, AppDynamics provides a neat way of instrumenting your java method – Information Points.

Infopoints

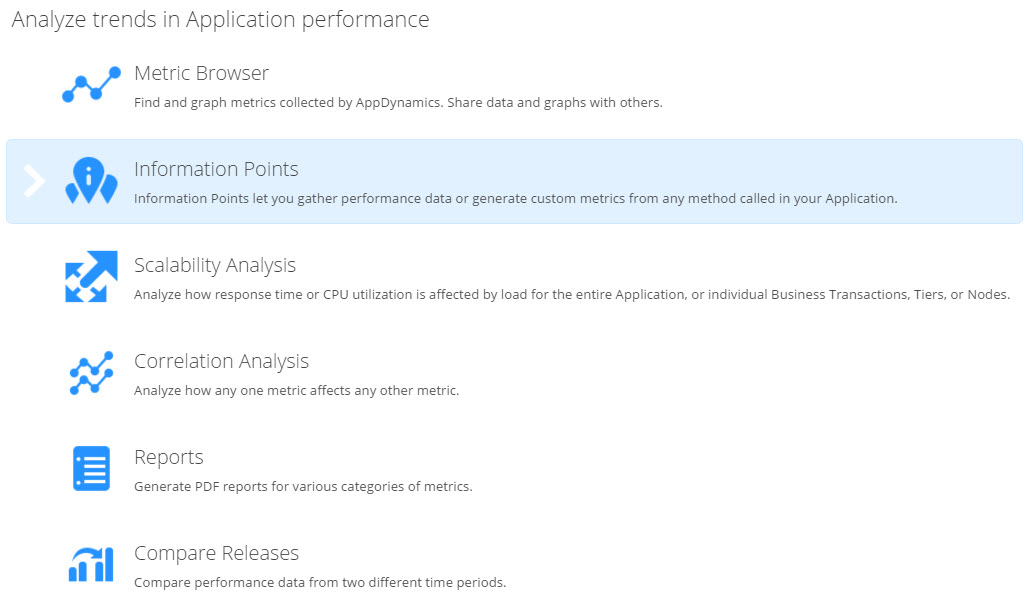
To configure a new Information Point, navigate to Analyze -> Information Points. Click on the New button at the top.

Read More

One of the major uses of an APM such as AppDynamics is the ability to collect application data at method level. For example, let’s say you have a method named processOrder in your code that accepts OrderID and Username as parameters.  What if you want to capture the Username as part of the performance metrics ?  This can be extremely valuable, for instance,  to identify which user could be submitting orders that are very slow to process. In AppDynamics, you can achieve this by using Data Collectors. In this blog post, let me show you how it is done.

  1. Log on to AppDynamics Controller UI
  2. Navigate to Configuration -> Instrumentation and click Data Collector tab
  3. You have two types of Data Collectors to choose from
    • Method Data Collector – Captures method arguments and return values.
    • HTTP Data Collector – Captures URLs, Headers and Cookies
  4. Click on Add under the Method Data Collector
  5. Configure the Method Data Collector as follows
    • Name: Provide a meaningful name for this Data Collector
    • Select Apply to new Business Transactions. If you don’t select this, you have to manually select the Business Transactions.
    • Provide the method signature (identifying a method) by its fully qualified class name and method name.
    • If the method is overloaded, i.e the same method name with various arguments, you need to select Is this Method Overloaded check box and choose the method signature you want to monitor
    • Optionally specify match condition to choose the method
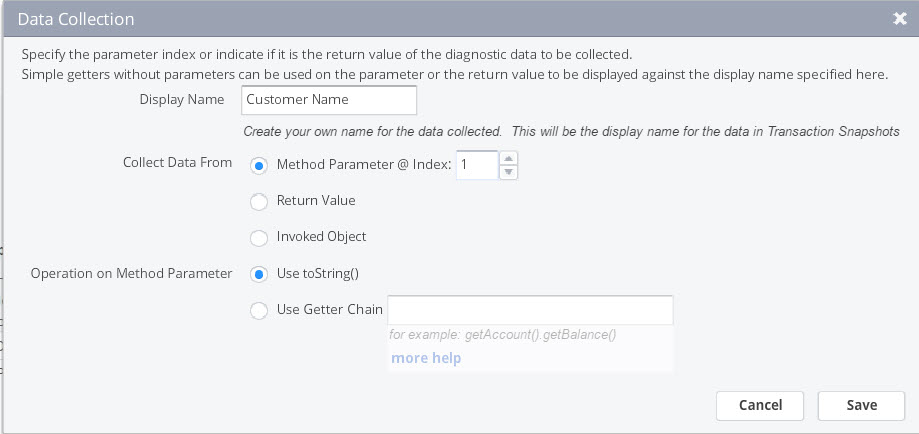
    • Under Specify the data to collect from this Method Invocation, enter a display name (this is the name that will show up in Transaction Snapshots under User Data) and the data to collect. You can collect method arguments and/or return valuesAppd
  6. Note that you can also configure HTTP Data Collector if you wish you capture HTTP metadata such as URLs, Cookies and Header values.

Read More

Glad you are here. It’s time to take a deeper look at all the various monitoring metrics that AppDynamics provides. We have so far done the following:

  1. Installed AppDynamics Controller
  2. Installed a sample application (Node.js,REST and mysql) and installed appdynamics agent
  3. Ensured the application shows up in the controller UI.

Note that we have not customized any monitoring elements yet. i.e whatever we are going to see is out-of-the box, which is one of the coolest things about AppDynamics. Let’s start.

How to view the Flow Map of the Application ?

Application flow map provides an excellent view of the data flow of the application. AppDynamics automatically tracks all the inbound and outbound calls of the instrumented application and attempts to draw this flow map. It is like an interactive Visio Diagram of the application infrastructure architecture that you did not create. (AppDynamics created it for you). Let’s take a look at the Flow Map of the sample application we have instrumented.

Read More