by Karun Subramanian
on June 10, 2017
So we all know that Java Heap is a crucial resource, lack of which will kill your application. Naturally you will want to monitor the heap usage. Bur surprisingly it is not very straight forward to measure the heap usage of your JVM unless you have a modern APM (Application Performance Management) tool implemented. To make things worse, in Windows world, the memory you see in Windows Task Manager (a solid tool by btw) is NOT the same as the JVM heap size.
For example, let’s say you have set maximum java heap at 3GB. But it is quite possible that the memory shown by Task Manager be higher (much higher at times), say 3.5 gb or 4 gb. You can pull you hair trying to figure out where that extra memory utilization came from, or you can read rest of this article and put an end to the mystery.
Generally speaking, here is the reason memory shown by the Task Manager is more than the Heap: The memory shown in Task manager is the entire Memory footprint of the JVM and NOT just the Java Heap of the JVM. Note that the JVM is just an another process as far as Windows is concerned.
Read More
by Karun Subramanian
on May 30, 2017
Few errors are deadlier than java.lang.OutOfMemory errors. When this happens, you application will run into a very unpredictable state, often hanging up and not processing new requests, coughing up ugly stack traces into users browsers etc. The most popular (and effective in the short run) fix for OutOfMemory error is simply restarting the Application or Application Server.
While running out of java Heap is the most common OutOfMemory error, there are indeed several types of OutOfMemory that can occur. In this post, I will show you these various types of OutOfMemory errors and what they mean.
java.lang.OutOfMemoryError: Java heap space
The most popular one. This is when JVM goes belly up and unable to allocate memory in Heap . Your application might appear hung up and extremely slow to respond to user requests.
For example, let’s say your Java application has 2GB of memory maximum (through -Xmx flag). When the entire 2GB is used up and GC is unable to reclaim any memory, the next memory allocation request for an object will fail with java.lang.OutOfMemory Error.
What causes java.lang.OutOfMemoryError: Java heap space ?
Read More
by Karun Subramanian
on May 29, 2017
Java 9 is supposed to be released in summer 2017. The biggest changes appear to be around modularization which enables you to create, build, deploy and reuse modules of code. There is also the new jshell command line tool that lets you test snippets of code quickly. From Application support standpoint, I see one major change in memory management and that’s what I want to discuss today.
GC (Garbage Collection) is the bread and butter of Memory Management in java. GC is responsible for cleaning up dead objects from memory and reclaiming that space. GC executes its cleanup using predefined Collectors that use certain algorithm(s). As I mentioned in my previous post, there are 4 Collectors that can be used.
- Serial Collector
- Parallel Collector
- CMS (concurrent Mark and Sweep) Collector
- G1 Collector
Until Java 1.8, on Server class machines (2 CPU and 2GB RAM minimum. Humor me if your server is leaner than this size), the default collector is Parallel collector.
Parallel collector is all about throughput. It does not care about having longer GC pause times (as it will stop the application threads before performing a GC). If you cannot tolerate long GC pause times (upwards of 1 second), you could choose CMS collector.
G1GC was introduced in Java 1.7 to address both increased throughput and decreased GC pause times overall.
Here is the major change with this edition of Java. G1GC is the default collector in Java 9.
Read More
by Karun Subramanian
on May 25, 2017
In this post, I’m going to explain how Heap is organized using generations and how Garbage Collection works behind the scene to free up memory. Java memory management has evolved a lot over the past few java releases. Understanding the mechanics underneath will help you better tune it (if required) to suit your needs.
When your java application runs, it creates objects which takes up memory space. As long the object is being used (i.e referred by the application somewhere), it is going to occupy the memory. When the object is no longer used (for example, when you cleanly close a DB connection), the space occupied by the object can be reclaimed by Garbage collection.
What are generations ?
Java heap is typically divided into two major pools. An area where short-lived objects live. And an area where long-lived objects live. Young generation (aka Nursery aka Eden) is the place for short-lived objects and Tenured generation (aka Old) is the place for long-lived objects.

Why Generations ?
Read More
by Karun Subramanian
on May 22, 2017
Heap is the memory space where java application objects are stored. Unfortunately the size of Heap is limited (by the -Xmx java command line option). When all of heap is used up, you are in deep trouble. So, it helps to understand how to measure Java heap usage, and that’s exactly what I’m going to be discussing with you in this post.
Very surprisingly, measuring heap is not that straight forward in java world. I believe it is due to the fact there are numerous ways to measure java heap. Oracle seems to introduce new tools with every release (and retire the old ones). For this reason, I recommend everyone to invest in a commercial grade APM (Application Performance Management) tool. With APM tool, you will simply login to the APM interface (typically a web application) to view the JVM heap usage (along with tons of other useful metrics)
Using the command jcmd to measure heap usage
Java comes with a command line tool named jcmd. It should be available in most flavors of Java (Oracle, IBM etc). I’m going to recommend jcmd to measure your heap usage. One of the advantages of using jcmd is the class histogram which not only shows the heap usage but it breaks down the usage by class. This gives you an instant view of what is causing heap to fill up.
Important Note: jcmd does have some impact on the jvm. But I assure it is worth the price, as the details shown by jcmd are very valuable.
Important Note: the command jcmd must be run as the same user (or effective user) as the user running the java application
Let us see jcmd in action.
Read More
by Karun Subramanian
on May 21, 2017
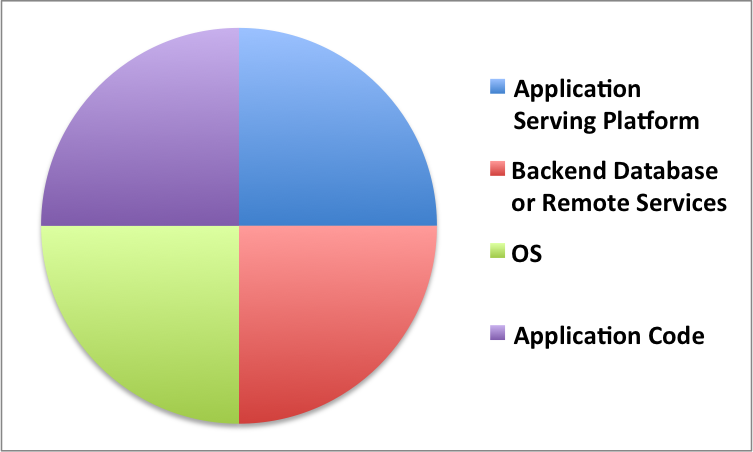
As an Application Support Engineer or a Lead Developer, you are supposed to save the day when things hit the fan. But this is easier said than done. I’ve dealt with these issues on a daily basis for couple of decades. In any enterprise application, there are 4 major subsystems that cause performance degradation or outage. Even though the Application platforms have drastically changed in the past few years, these 4 subsystems still make up majority (if not all) of the issues. Understanding this obvious, yet often overlooked fact, you will be able to ask intelligent questions during troubleshooting.
Without further due, here are those:
- Application Serving Platform (typically an Application Server or PAAS)
- Backend Database or other Remote service(s) that your application depends on
- The Operating System that hosts the Application
- Application Code
And no, Network is NOT one of the major subsystems to point finger at. That is not to say that Network issues do not occur at all. But in practice, I would look at Network when all other suspects have been eliminated.
Also note that the 4 subsystems listed are not in any order. That is, they all have equal chances of being the culprit.
Image: 4 Subsystems responsible for Application stability
(C) Karun Subramanian
Read More
by Karun Subramanian
on March 15, 2017
Remember how Adobe (Macromedia) Flash created such a buzz and ruled the world for over a decade ? While websites created with HTML/CSS/CGI looked like beat-up Kia, websites created with Flash looked like brand new Mercedes Benz. A complete industry was born after Flash animation. Alas, Flash is destined to die due to the enormous amount of security vulnerabilities and Performance issues. While I’m sad that Flash is going away, that is the reality in this fast-paced Information Era. Only the fittest survive. And we are about to see if Java EE is fit enough.
Image Source: oracle.com
Read More
by Karun Subramanian
on September 14, 2016
While Unix/Linux is the most popular OS for hosting enterprise java applications, there are still significant amount of applications deployed on Windows Platform. If your application is running on a Windows box, you ought to know how to get around Windows in order to support your application effectively.
In this piece, I’m going to share with you 10 tricks every Java Developer should know. I tested these in Windows 2008 R2. But it should work on most Windows flavors. Let’s get right to it.
1. Find the full command line of your java application
In Unix/Linux, if you need to see the full command line of your application, you can simply use ‘ps –ef’. For example,
ps –ef | grep <my application>
Alas! There is no ‘ps’ in windows. So, how do you do this? Say hello to Windows Task Manager.
Read More
by Karun Subramanian
on September 3, 2016
Oracle Hotspot, IBM SDK, HP NonStop Server for Java, Jrockit…. Why so many flavors of JVM? And more importantly, why do you care ?
While it is Sun/Oracle that originally created the Java Virtual Machine, since JVM is basically a set of specifications, any vendor could create their own version of JVM. Several vendors jumped in to create their spin offs. Some are free and open source but some are proprietary. The following JVMs are prominent in the market today
IBM
HP
Sun/Oracle Hotspot
BEA/Oracle Jrockit
OpenJDK
In addition to the above, Apple has their own spin off that is used in MAC.
Sun/Oracle HotSpot is still the market leader (about 60%). Oh, by the way, you will be surprised to know that there are more than 30 JVMs out there. Did you know apache had its own JVM (Apache harmony) ?
Why do you care which JVM is being used?
As an Application Support Engineer, you have to care about the flavor of the JVM for four major reasons
Read More
by Karun Subramanian
on September 3, 2016
In a JEE Application Server such Oracle WebLogic or IBM WebSphere, where exactly does JVM fit in?
In short, each instance of a JEE Application server runs as a JVM that executes one or more JEE Applications deployed. In other words, Application Server is yet another java application (a big one) that executes custom developed JEE Applications.
Earlier we saw how a JVM can be started by using the ‘java’ command and passing the class name as the parameter
java HelloWorld
In a JEE Application Server’s case, it will be something like this:
java –classpath /opt/jboss-as/bin/run.jar com.jboss.Main
The above example starts a Jboss Application Server. Note that there will be several additional Java command line parameters in real world.
Let us understand what a JEE Application Server really is.
Read More