So we all know that Java Heap is a crucial resource, lack of which will kill your application. Naturally you will want to monitor the heap usage. Bur surprisingly it is not very straight forward to measure the heap usage of your JVM unless you have a modern APM (Application Performance Management) tool implemented. To make things worse, in Windows world, the memory you see in Windows Task Manager (a solid tool by btw) is NOT the same as the JVM heap size.
For example, let’s say you have set maximum java heap at 3GB. But it is quite possible that the memory shown by Task Manager be higher (much higher at times), say 3.5 gb or 4 gb. You can pull you hair trying to figure out where that extra memory utilization came from, or you can read rest of this article and put an end to the mystery.
Generally speaking, here is the reason memory shown by the Task Manager is more than the Heap: The memory shown in Task manager is the entire Memory footprint of the JVM and NOT just the Java Heap of the JVM. Note that the JVM is just an another process as far as Windows is concerned.

Let’s just first clarify couple of the Windows Memory Management terminology.
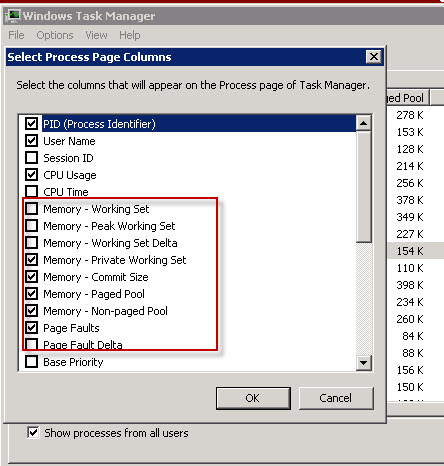
Memory (Private working set): This is the default value shown in Windows Task Manager. Working set is simply the amount of memory currently in use for the process. Private Working set means the memory is dedicated to this process and cannot be shared with other processes.
Commit size: This is the amount of memory that the process has touched, which includes both RAM and Page file (disk). This will be the highest of all Memory Metrics for a given process.
Page Faults: Is the number of times Windows needed to get the data requested from Page file (disk) rather than from RAM (note that this is NOT an error condition).
In Windows Task Manager, under View -> Select Columns, you can select/deselect various Memory Metrics.
So, what is the significance of Windows Tasks Manager Memory metric for Java Applications ? Native Memory.
If you are running out of Native memory, Windows Task manager can be useful to check if the memory utilization shoots up when the OutOfMemory error (for native memory) occurs. But that’s about as useful as it gets. There is not much you can do with it further. Dealing with Native memory leak for a Java application is a messy business, especially in Windows. Please see this article for a quick overview of various OutOfMemory Errors.
What is the takeaway ? Just because Windows Task manager shows an exorbitant amount of memory being used by your JVM process, it does NOT mean that Java Heap is getting filled with Application objects. The sure way of finding out the JVM heap size is using an APM tool (or by using JDK tools such as Jconsole, VisualVM etc).
Hope this clarifies the mystry. If you had encountered interesting issues with Java Memory in Windows, please comment below so we can get a conversation going.
Thanks guys, see you next time.