≡ Menu

Log Management

My New Book on Splunk

I’m super excited to announce that my new book Practical Splunk Search Processing Language has been published.

While there are many Splunk books in the market today, almost all of them try to combine several aspects of Splunk into one book. I’ve not found a single book that focuses solely on teaching SPL (Search Processing Language). For a user, learning SPL is the key to getting the most out of the Splunk platform. So, I decided to fill in the gap :-).

I know that SPL can be intimidating for a new user (heck, even for an experienced user, it can be intimidating). But it does not have to remain that way. The key to mastering SPL is to focus on a handful of commands and fully mastering them. For example, while SPL has more than 140 commands, you’ve probably only used the following commands more often than not:

Read More

Splunk Search Modes: Fast vs. Smart vs. Verbose

If you are new to Spunk, you’ve probably seen the Search Mode option in the search interface, and wondering what in the world is Search Mode. Even some of the experienced Splunkers don’t fully understand the search modes. May be you run all of your searches in the verbose mode (not recommended), or may be all in fast mode (not recommended), or you want to play it nice and use smart mode (recommended, may be). By reading this blog post, you will fully understand what these search modes actually mean and thereby will be equipped to make the right choice. You can also find a video with demo at the end of this post. Let’s get started.

Search Modes

In Splunk search interface, the Search mode shows up right underneath the time picker. See figure 1.

Figure 1: Search Mode in Splunk search interface

When you click on the drop down arrow, you are provided with three options.

Read More

One of the most frequently asked questions in Splunk is the difference between universal forwarder and heavy forwarder. In this post, I’ll explain the difference and suggest when to use certain type of forwarder. Let’s roll.

What is a Splunk Forwarder?

A Splunk forwarder reads data from a data source and forwards to another Splunk or Non-Splunk process. It is one of the core components of Splunk platform, the others being Splunk indexer and Splunk search head. Figure 1 shows a super high level architecture of Splunk platform:

While there are many ways to get data into Splunk platform, Splunk Universal Forwarder is by far the most common way to get data in. The other ways of getting data in, sorted by the popularity, based strictly on my experience:

Read More

How to use rex command to extract fields in Splunk?

One of the most powerful features of Splunk, the market leader in log aggregation and operational data intelligence, is the ability to extract fields while searching for data. Unfortunately, it can be a daunting task to get this working correctly. In this article, I’ll explain how you can extract fields using Splunk SPL’s rex command. I’ll provide plenty of examples with actual SPL queries. In my experience, rex is one of the most useful commands in the long list of SPL commands. I’ll also reveal one secret command that can make this process super easy. By fully reading this article you will gain a deeper understanding of fields, and learn how to use rex command to extract fields from your data.

What is a field?

A field is a name-value pair that is searchable. Virtually all searches in Splunk uses fields. A field can contain multiple values. Also, a given field need not appear in all of your events. Let’s consider the following SPL.

index=main sourcetype=access_combined_wcookie action=purchase

The fields in the above SPL are “index”, “sourcetype” and “action”. The values are “main”, “access_combined_wcookie” and “purchase” respectively.

Fields in Splunk

Fields turbo charge your searches by enabling you to customize and tailor your searches. For example, consider the following SPL

Read More

Splunk vs ELK

If you are in IT Operations in any role, you have probably come across either Splunk or ELK, or both. These are two heavyweights in the field of Operational Data Analytics. In this blog post, I’m going to share with you what I feel about these two excellent products based on my years of experience with them.

The problem Splunk and ELK are trying to solve: Log Management

While there are fancier terms such as Operational Data Intelligence, Operational Big Data Analytics and Log data analytics platform, the problem both Splunk and ELK are trying to solve is Log Management. So, what’s the challenge with Log management?

Logs, logs, logs and more logs


The single most important piece of troubleshooting data in any software program is the log generated by the program. If you have ever worked with vendor support for any software product, you have been inevitably asked to provide – you guessed it, Log files. Without the log files, they really can’t see what’s going on.

Logs not only contains information about how the software program runs, they may contain data that are valuable to business as well. Yeap, that’s right. For instance, you can retrieve wealth of data from your Web Server access logs to find out things like geographical dispersion of your customer base, most visited page in your website, etc.

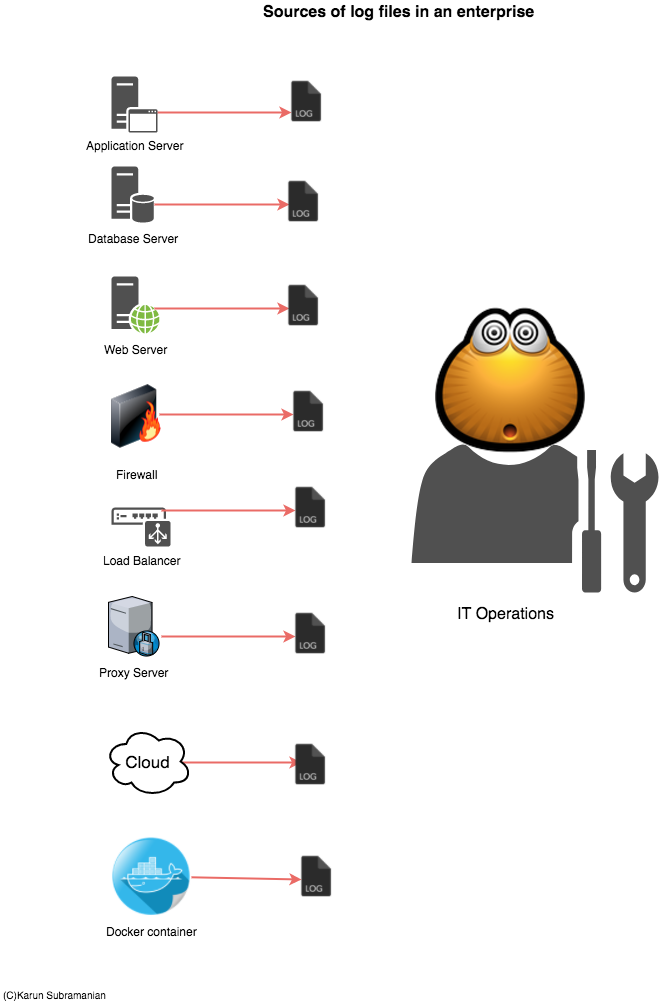
If you are running only a couple of servers with few applications running on them, accessing and managing your logs are not a problem. But in an enterprise with hundreds and even thousands of servers and applications, this becomes an issue. Specifically,

  1. There are thousands of log files.
  2. The size of these log files run in Giga or even Terra bytes.
  3. The data in these log files may not be readily readable or searchable (unstructured data)

Sources_of_logfiles (4)

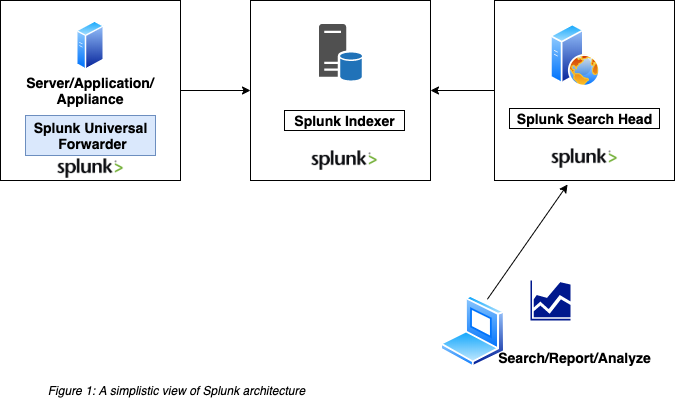
Both Splunk and ELK attempt to solve the problem of managing ever growing Log data. In essence, they supply a scalable way to collect and index log files and provide a search interface to interact with the data. In addition, they provide a way to secure the data being collected and enable users to create visualizations such as reports, dashboards and even Alerts.

Now that you know the problem Splunk and ELK are attempting to solve, let’s compare them and find how they are achieving this. I’m going to compare them in 4 areas as follows:

Technology

Cost

Features

Learning Curve for the operations team

Got it ? I can’t wait to share. Let’s dive in.

Splunk_image

VS

ElasticSearch Logo

Read More

3 less popular Log Analysis Tools that are free

Analyzing logs can be fun, tricky, frustrating and valuable – all at the same time. As a problem solver, you must equip yourself with efficient tools to do the mundane work. In this article, let me show you three somewhat less popular log analysis tools. They are less popular because they are sparingly used by companies here and there (mainly due to Administrators becoming familiar with a certain tool over time). Check these out, who knows you might end up liking one of these tools and put it to good use.

  1. Apache Chainsaw

    Apache log4j is the foundation for java based applications. Chanisaw was written to provide a graphical view of log4j logs.

    Image source: http://logging.apache.org/chainsaw/

    Some notable features:

    1. Powerful filtering

      You can use expression based filtering and also do some quick-and-dirty filtering

    2. Coloring

      Specify your own rules to highlight log records

    3. Capturing remote events

      Using the ‘Receiver’ concept you can configure chainsaw to capture logs from a remote source

Read More

A log file is the single most important piece of resource you need in order to tackle almost any problem with your application. I still remember having to troubleshoot complex application performance issues when APM tools were not yet born. All I had were access.log and error.log from a Web Server, standard out and standard error file from the application, and the syslog from the host OS. And guess what? They were more than enough to see what was going on.

But gone are the good old days. The complexity software and hardware infrastructure on which applications are presently deployed is beyond imagination. Application infrastructure is increasingly becoming sort of ‘black box’, and having the right tools to gain insight to this black box is mission critical.

Two parallel set of management software have emerged:

Read More

How to setup curator to archive old Elastic Search indices

If you don’t have a proper archival process, data in your elastic search cluster will grow uncontrollably. You risk losing valuable log data if you don’t make sure you have enough space in your disk subsystem. From the elastic search log file, you might see messages like below:

[INFO ][cluster.routing.allocation.decider] [myELK-Node2] low disk watermark [85%] exceeded on [aULsc9C7R1ecGfHvy0gNqg][ myELK -Node1] free: 2gb[10%], replicas will not be assigned to this node

[WARN ][cluster.routing.allocation.decider] [myELK -Node2] high disk watermark [90%] exceeded on [G19eWLL9Skqcq8Mb0p-xTg][ myELK -Node2] free: 1.9gb[9.8%], shards will be relocated away from this node

INFO ][cluster.routing.allocation.decider] [myELK -Node2] high disk watermark exceeded on one or more nodes, rerouting shards

That is not pretty.

There are few ways to delete unused/old indexes.

Read More

ELK (Elasticsearch) up and running in few minutes

There is an excellent how-to blog post written by Philippe Creux on how to deploy ELK stack. He goes to explain in detail his logstash configuration files and other technical stuff.

For anyone looking to get a quick start on ELK, I would recommend browsing through this article.

ELK has been creating lot of buzz and for good reasons. It is fast, reliable, highly scalable and above all, easy to setup. It is totally cloud friendly. Almost every setting in Elastic search is preconfigured and ready to use for production deployment (note: almost).

Though not necessary, it is recommended to introduce a queuing mechanism before logstash crunches the data and sends to Elasticsearch. This queue provides a buffer so that Logstash does not get overloaded with surge in data. In this way, you have time to react for scaling your environment without choking. Rabbitmq is a popular choice for ELK stack.

Here is the full article. Thanks much for folks at brewhouse for sharing this.

http://brewhouse.io/blog/2014/11/04/big-data-with-elk-stack.html


Happy Monitoring!

Elastic{ON} 2nd annual Elasticsearch User Conference

Elastic has announced the agenda for the 2nd annual Elasticsearch User Conference. It is a 3 day conference packed with tons of useful information. If you are a serious user of Elasticsearch, or even thinking about deploying Elasticsearch in the future, this conference has lot to offer.

The conference is going to be held at San Francisco for 3 days from Feb 17 through Feb 19 of 2016. It is expected to receive at least two thousand attendees. So, it is going to be BIG.

While there will be lots of information shared about future roadmap of Elastic Search, the real exciting part, and the biggest bang for the buck, in my opinion, will be the presentations from current Elasticsearch users. It will be eye-opening to see how companies use Elasticsearch to manage their log ecosystem. You will get to meet real world users of Elasticsearch and it opens doors for creating a superb Network or expanding your current one.

Featured speakers include Shay Banon, Founder and CTO of ElasticSearch, Rashid Khan, Kibana Creator, Jordan Sissel, Logstash Creator, Simon Willnauer, Founder and Tech Lead and Elasticsearch.

There will be live demos and you can get your hands dirty too, if you want. There are 40+ sessions of lecture. There will also be couple of ‘Ask me anything’ sessions that are wide open for wild questions.

Overall, I believe it will be worth the time and money to attend the conference if you are serious about deploying and using Elasticsearch.

Unfortunately, I won’t be able to attend this year (hopefully, next year J)

Please let me know if you guys attend and drop a couple of lines on your experience.

Here is the complete agenda of the conference:

https://www.elastic.co/elasticon/conf/2016/sf/agenda

Happy Monitoring