by Karun Subramanian
on June 10, 2017
So we all know that Java Heap is a crucial resource, lack of which will kill your application. Naturally you will want to monitor the heap usage. Bur surprisingly it is not very straight forward to measure the heap usage of your JVM unless you have a modern APM (Application Performance Management) tool implemented. To make things worse, in Windows world, the memory you see in Windows Task Manager (a solid tool by btw) is NOT the same as the JVM heap size.
For example, let’s say you have set maximum java heap at 3GB. But it is quite possible that the memory shown by Task Manager be higher (much higher at times), say 3.5 gb or 4 gb. You can pull you hair trying to figure out where that extra memory utilization came from, or you can read rest of this article and put an end to the mystery.
Generally speaking, here is the reason memory shown by the Task Manager is more than the Heap: The memory shown in Task manager is the entire Memory footprint of the JVM and NOT just the Java Heap of the JVM. Note that the JVM is just an another process as far as Windows is concerned.
Read More
by Karun Subramanian
on May 21, 2017
As an Application Support Engineer or a Lead Developer, you are supposed to save the day when things hit the fan. But this is easier said than done. I’ve dealt with these issues on a daily basis for couple of decades. In any enterprise application, there are 4 major subsystems that cause performance degradation or outage. Even though the Application platforms have drastically changed in the past few years, these 4 subsystems still make up majority (if not all) of the issues. Understanding this obvious, yet often overlooked fact, you will be able to ask intelligent questions during troubleshooting.
Without further due, here are those:
- Application Serving Platform (typically an Application Server or PAAS)
- Backend Database or other Remote service(s) that your application depends on
- The Operating System that hosts the Application
- Application Code
And no, Network is NOT one of the major subsystems to point finger at. That is not to say that Network issues do not occur at all. But in practice, I would look at Network when all other suspects have been eliminated.
Also note that the 4 subsystems listed are not in any order. That is, they all have equal chances of being the culprit.
Image: 4 Subsystems responsible for Application stability
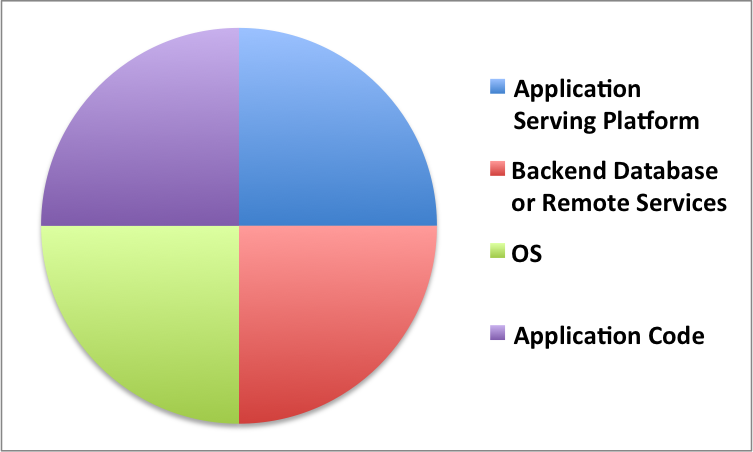
(C) Karun Subramanian
Read More
by Karun Subramanian
on May 11, 2016
Troubleshooting JVM memory issues can be daunting, but you if you don’t fix it, it can kill your application and possibly your face in front of your customers. There is good news though. With any modern APM tool, you virtually get an X-Ray vision to this labyrinth named Java Heap.
In this blog post, I’ll show you how to use AppDynamics to troubleshoot Java memory issues.
AppDynamics is one of the leading APM vendors in the market, providing tons of useful tools ranging from Hardware monitoring to End user experience monitoring to operational data analytics (Actually it can be quite overwhelming. If you don’t know what exactly you are looking for in the tool, you can go in circles. But don’t worry, I can help).
There are three major areas where AppDynamics can help in regards to Java memory troubleshooting.
Read More
by Karun Subramanian
on April 17, 2016
Software installation has never been more fulfilling since YUM came along.
YUM is the most popular rpm based interactive package manager. It is super powerful and reliable.
In this quick article, I show how to install apache web server, the world’s most popular web server in your Linux Server.
You need to have root access to do this. You also need to have internet access on the server you are installing apache.
Simply run the command
sudo yum install httpd
That’s it. Yum does the rest.

Once done, which takes about 10 seconds, start the httpd server
Sudo service httpd start

Once the service starts, simply use a browser to access the server (use the default server name or the ip address).
Or you can choose the geeky way to use curl to test out. I created a basic html file. Here is how to access it
Curl http://localhost/index.html
You can check access.log to see how you did. Access_log is present under /var/log/httpd/

The configuration file for apache (httpd.conf) will be under /etc/httpd. (This depends on your platform).
That’s it. Your own enterprise grade Web Server, up and running in about 10 seconds.
Way to go YUM !!
by Karun Subramanian
on April 15, 2016
We live in the world of APMs where traffic lights in fancy dashboards show us what’s wrong with our applications in a heartbeat. Definitely a proud achievement (and I highly recommend investing in an APM solution). But at times, you have to get down to very basic, old fashioned troubleshooting. And to be honest with you, it is outright fun.
In this article I want to show you how you can troubleshoot using web server access log. I am going to use Apache 2.X as example web server (Even with Nginx on the rise, apache is still the most popular web server in the world. Sorry IIS).
Before we dive in to the access log, here is a very high level architecture that shows where apache typically sits. For simplicity sake, I have not shown things like DMZ zone, Caching servers, Web Access Firewalls, Reverse proxys etc)
Read More
by Karun Subramanian
on June 20, 2015
So, what can an APM tool buy you? Setting aside the hypothetical ‘Peace of mind’ marketing pitch, let me show you how exactly an APM tool can help you support your Application effectively
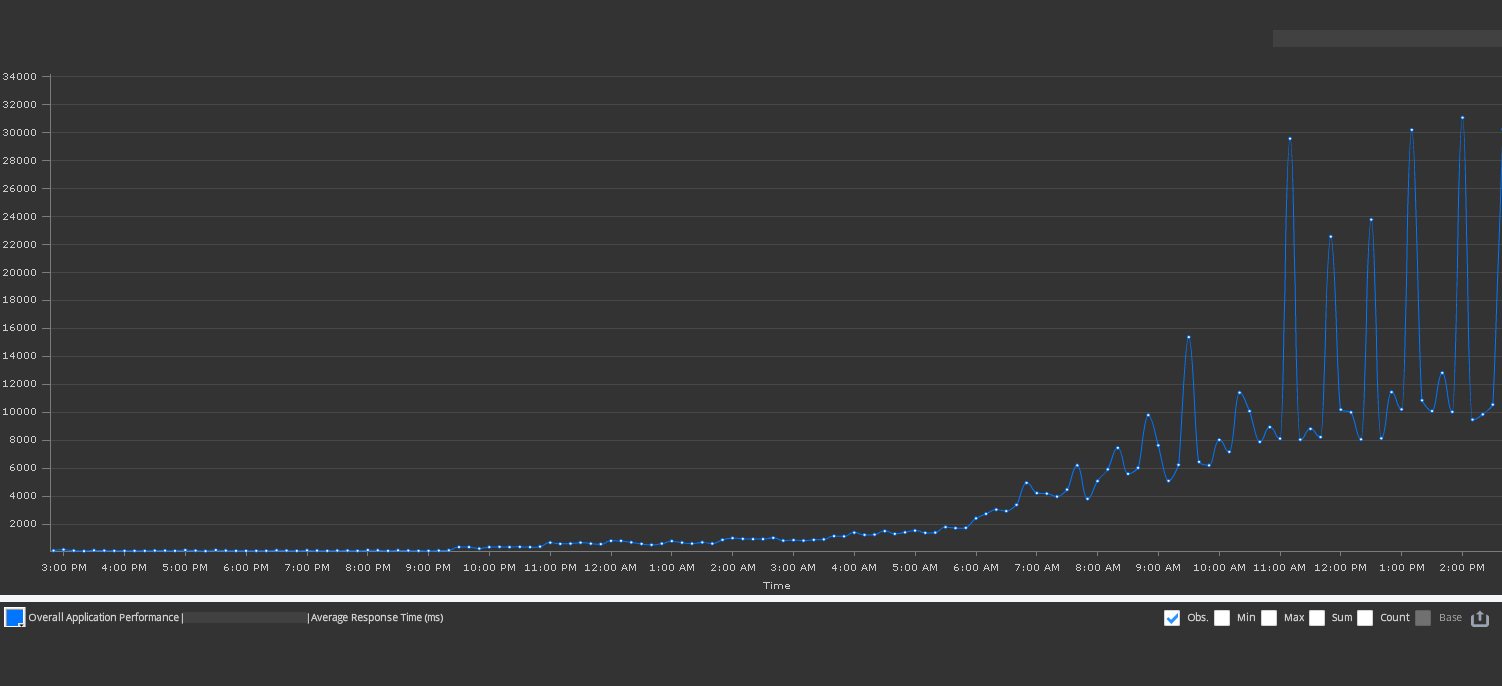
1. Historic Monitoring of Key Metrics
APM tool can record the monitoring metrics which are invaluable in troubleshooting. For example, take a look at the ‘response time’ graph of a particular application. You can readily see that the application suffers during business hours.
Read More
by Karun Subramanian
on June 20, 2015
Back in the 90s when I was working as a Solaris/HP-UX Administrator, all I needed was two or three commands to figure out what was wrong with a particular Server or Application. I will just glance at ‘vmstat’, ‘iostat’ and ‘top’ for a minute or two and the problem will reveal itself clearly. While those command still prove valuable at a certain level, in order to answer ‘Why is the application slow’ you need much more than just few OS commands.
Read More
by Karun Subramanian
on June 18, 2015
In your Application support/Developer Journey, you will definitely come across a time where you will want to really dive into the Java heap and see what is filling up the memory. We are literally talking about all those java objects that are in the heap. Mind you this can run into hundreds of millions in numbers. How do you get an insight into what is in the Heap? By analyzing a Heap dump. And how do you analyze the heap dump? By using the all-powerful Eclipse Memory Analyzer (MAT)
Before we begin using MAT, how do you capture heap dump?
Now, this varies from application to application. For example, if you are running IBM WebSphere, you could use a wsadmin script to invoke heap dump. Earlier you saw visualvm can create a heap dump for you through the visualvm interface. You can also use the command ‘jmap’ to create heap dump. Further you can configure the Application server to automatically perform a heap dump when an ‘out of memory’ error is encountered (XX:-HeapDumpOnOutOfMemoryError). Note that this option is verified to work on Oracle Hotspot JVM only.
Downloading Eclipse MAT:
Read More
by Karun Subramanian
on June 18, 2015
IBM has given us a great tool that we can use to analyze verbose GC files literally in seconds. I’m not kidding. All you have to do is generate verbose GC logs for few hours and feed the file to this tool and Bingo; it analyzes the file and tells you what you need to know. Let’s see this tool in action.
Downloading IBM Pattern Modeling and Analysis Tool for Java Garbage Collector:
https://www.ibm.com/developerworks/community/groups/service/html/communityview?communityUuid=22d56091-3a7b-4497-b36e-634b51838e11
Click on the ‘download’ link at the bottom of the page. You will get a jar file named “ga<version>.jar”.
For example, ga456.jar.
Invoking IBM PMAT:
Read More
by Karun Subramanian
on March 20, 2015
Application monitoring is vital for any organization. But implementing and maintaining a reliable Application monitoring system can be a very complex process, primarily because of the number of various metrics that can be monitored. In this article, I would like to take you back to the basics, and explain two chief metrics that you must monitor no matter what your application is or does.
Read More