We live in the world of APMs where traffic lights in fancy dashboards show us what’s wrong with our applications in a heartbeat. Definitely a proud achievement (and I highly recommend investing in an APM solution). But at times, you have to get down to very basic, old fashioned troubleshooting. And to be honest with you, it is outright fun.
In this article I want to show you how you can troubleshoot using web server access log. I am going to use Apache 2.X as example web server (Even with Nginx on the rise, apache is still the most popular web server in the world. Sorry IIS).
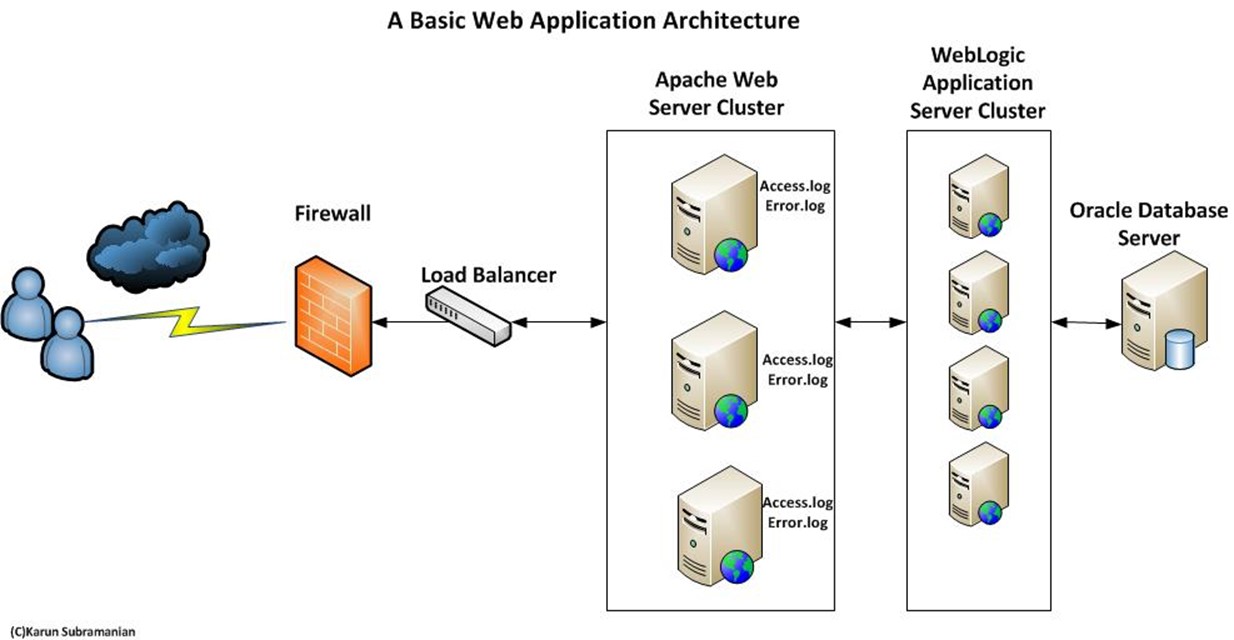
Before we dive in to the access log, here is a very high level architecture that shows where apache typically sits. For simplicity sake, I have not shown things like DMZ zone, Caching servers, Web Access Firewalls, Reverse proxys etc)
Let’s get down to it. There are two important log files that apache web server creates.
Error log: Typically /var/httpd/log/error_log, but customizable via ErrorLog directive in httpd.conf file.
Access_log: Typically <apache home>/logs/access_log, but customizable via CustomLog directive in httpd.conf.
Every request to apache web server is recorded in access.log.
Let is dissect what’s in a typical access log file. You will immediately see the value of reviewing access log.
For this article, I quickly whipped up a fresh apache web server in a new AWS Amazon Linux Server. You can get your own server for free. You can check out the details in my other article here.
I installed apache using yum, started the service, created a basic html page and used curl to access the page. This generates some entries in access_log that I can use to show you what’s in this log file.
Let us examine the following access log entry:
127.0.0.1 – – [15/Apr/2016:07:13:23 +0000] “GET /index.html HTTP/1.1” 200 160 “-” “curl/7.40.0”
Here is how to read this:
| 127.0.0.1 | Client IP address. In this case it is local host |
| – | Remote logname if available |
| – | Remote user name if the user was authenticated. Very useful field. |
| [15/Apr/2016:07:13:23 +0000] | Request received time. |
| GET /index.html HTTP/1.1 | First line of request. This is generally the HTTP verb followed by the requested URI followed by the HTTP version |
| 200 | Status of the HTTP request. Very useful field. |
| 160 | Response size in bytes (does not include size of HTTP headers) |
| “-“ | Referrer – page that initiated the request |
| curl/7.40.0 | User-agent of the client. If it is a browser based client, you will see the browser name here |
Right away, you can see the value. You can tell tons of information about requests being served by your web service.
For example, can you tell if certain pages of your application is erroring out with ‘500 internal server error’ ? You betcha. Open the access_log and just look for HTTP return code of 500.
Can you tell if a certain client is having unusually high volume today? Sure thing. Look for the client_ip.
And so on.
Note that the format of the access_log can be greatly controlled. This setting is in httpd.conf file. Look for LogFormat directive. Here is my entry.
LogFormat “%h %l %u %t \”%r\” %>s %b \”%{Referer}i\” \”%{User-Agent}i\””
A very useful field to add:
Whenever possible, I configure the ‘time taken to serve the request (%T) for my customers. It does not add lot of overhead but it can be super useful. You can tell how long each request is taking to process.
You must be wondering if there are other useful fields. Here is the complete list. Knock yourself out.
| Format String | Description |
| %% | The percent sign. |
| %a | Client IP address of the request (see the mod_remoteip module). |
| %{c}a | Underlying peer IP address of the connection (see the mod_remoteip module). |
| %A | Local IP-address. |
| %B | Size of response in bytes, excluding HTTP headers. |
| %b | Size of response in bytes, excluding HTTP headers. In CLF format, i.e. a ‘-‘ rather than a 0 when no bytes are sent. |
| %{VARNAME}C | The contents of cookie VARNAME in the request sent to the server. Only version 0 cookies are fully supported. |
| %D | The time taken to serve the request, in microseconds. |
| %{VARNAME}e | The contents of the environment variable VARNAME. |
| %f | Filename. |
| %h | Remote hostname. Will log the IP address if HostnameLookups is set to Off, which is the default. If it logs the hostname for only a few hosts, you probably have access control directives mentioning them by name. See the Require host documentation. |
| %H | The request protocol. |
| %{VARNAME}i | The contents of VARNAME: header line(s) in the request sent to the server. Changes made by other modules (e.g. mod_headers) affect this. If you’re interested in what the request header was prior to when most modules would have modified it, use mod_setenvif to copy the header into an internal environment variable and log that value with the %{VARNAME}e described above. |
| %k | Number of keepalive requests handled on this connection. Interesting if KeepAlive is being used, so that, for example, a ‘1’ means the first keepalive request after the initial one, ‘2’ the second, etc…; otherwise this is always 0 (indicating the initial request). |
| %l | Remote logname (from identd, if supplied). This will return a dash unless mod_ident is present and IdentityCheck is set On. |
| %L | The request log ID from the error log (or ‘-‘ if nothing has been logged to the error log for this request). Look for the matching error log line to see what request caused what error. |
| %m | The request method. |
| %{VARNAME}n | The contents of note VARNAME from another module. |
| %{VARNAME}o | The contents of VARNAME: header line(s) in the reply. |
| %p | The canonical port of the server serving the request. |
| %{format}p | The canonical port of the server serving the request, or the server’s actual port, or the client’s actual port. Valid formats are canonical, local, orremote. |
| %P | The process ID of the child that serviced the request. |
| %{format}P | The process ID or thread ID of the child that serviced the request. Valid formats are pid, tid, and hextid. hextid requires APR 1.2.0 or higher. |
| %q | The query string (prepended with a ? if a query string exists, otherwise an empty string). |
| %r | First line of request. |
| %R | The handler generating the response (if any). |
| %s | Status. For requests that have been internally redirected, this is the status of the original request. Use %>s for the final status. |
| %t | Time the request was received, in the format [18/Sep/2011:19:18:28 -0400]. The last number indicates the timezone offset from GMT |
| %{format}t | The time, in the form given by format, which should be in an extended strftime(3) format (potentially localized). If the format starts with begin:(default) the time is taken at the beginning of the request processing. If it starts with end: it is the time when the log entry gets written, close to the end of the request processing. In addition to the formats supported by strftime(3), the following format tokens are supported: |
| sec number of seconds since the Epoch | |
| msec number of milliseconds since the Epoch | |
| usec number of microseconds since the Epoch | |
| msec_frac millisecond fraction | |
| usec_frac microsecond fraction | |
| These tokens can not be combined with each other or strftime(3) formatting in the same format string. You can use multiple %{format}t tokens instead. | |
| %T | The time taken to serve the request, in seconds. |
| %{UNIT}T | The time taken to serve the request, in a time unit given by UNIT. Valid units are ms for milliseconds, us for microseconds, and s for seconds. Using sgives the same result as %T without any format; using us gives the same result as %D. Combining %T with a unit is available in 2.4.13 and later. |
| %u | Remote user if the request was authenticated. May be bogus if return status (%s) is 401 (unauthorized). |
| %U | The URL path requested, not including any query string. |
| %v | The canonical ServerName of the server serving the request. |
| %V | The server name according to the UseCanonicalName setting. |
| %X | Connection status when response is completed: |
| X = Connection aborted before the response completed. | |
| + = Connection may be kept alive after the response is sent. | |
| – = Connection will be closed after the response is sent. | |
| %I | Bytes received, including request and headers. Cannot be zero. You need to enable mod_logio to use this. |
| %O | Bytes sent, including headers. May be zero in rare cases such as when a request is aborted before a response is sent. You need to enable mod_logioto use this. |
| %S | Bytes transferred (received and sent), including request and headers, cannot be zero. This is the combination of %I and %O. You need to enablemod_logio to use this. |
| %{VARNAME}^ti | The contents of VARNAME: trailer line(s) in the request sent to the server. |
| %{VARNAME}^to | The contents of VARNAME: trailer line(s) in the response sent from the server. |
Source: httpd.apache.org
There it is. Get yourself familiar with Apache access_log. It can be very useful in dealing with complex issues. If possible, update the default format to include %T (Time taken to process the request) as it provides tremendous value.
Keep up the great work you do as a support engineer – the best profession there is.
Good luck
Karun
Comments on this entry are closed.