In this post, I’m going to explain how Heap is organized using generations and how Garbage Collection works behind the scene to free up memory. Java memory management has evolved a lot over the past few java releases. Understanding the mechanics underneath will help you better tune it (if required) to suit your needs.
When your java application runs, it creates objects which takes up memory space. As long the object is being used (i.e referred by the application somewhere), it is going to occupy the memory. When the object is no longer used (for example, when you cleanly close a DB connection), the space occupied by the object can be reclaimed by Garbage collection.
What are generations ?
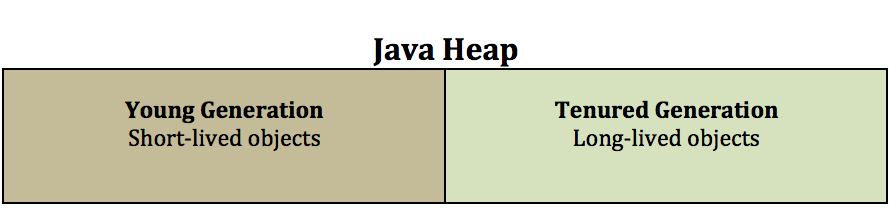
Java heap is typically divided into two major pools. An area where short-lived objects live. And an area where long-lived objects live. Young generation (aka Nursery aka Eden) is the place for short-lived objects and Tenured generation (aka Old) is the place for long-lived objects.
Why Generations ?
A big (and very valid) assumption behind generational heap management is this: Most of the objects created by an application are short-lived. What this means is, by allocating short-lived objects in a certain area of heap, we could run garbage collections ONLY on that particular area instead of running it on whole of the heap. Why is this good? GC takes time and resource, sometimes significant time and resource. By running GC only on the young generation, we can get away with minimal interruption to your application.
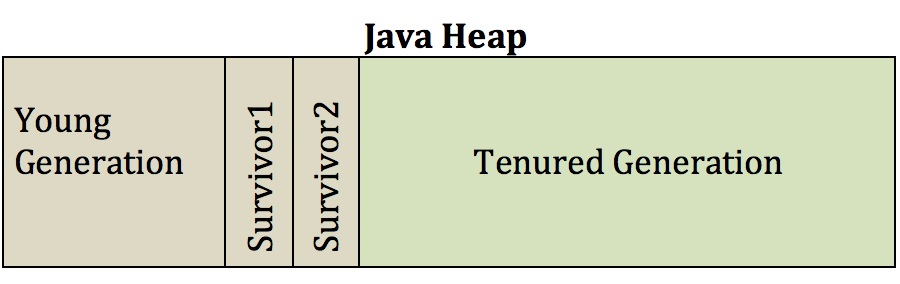
So, when the young generation memory pool fills up, a minor collection is run. After clearing the dead objects, the remaining objects (survivors) are moved to the Tenured Generation. Eventually Tenured Generation fills up and a major collection is triggered at that point (Full GC)
Now, I’m going to focus on HotSpot Java 8 for the remainder of this post. Other flavors (IBM, HP etc) closely follow HotSpot but there are subtle differences.
What are collectors ?
Java Garbage Collection is executed by Collectors. There are four collectors to choose from. These collectors use certain algorithm(s) to perform the garbage collection.
- Serial Collector
- Parallel Collector
- CMS (Concurrent Mark and Sweep) Collector
- G1 Collector
By default, in server class machines (2 CPU and 2GB RAM minimum) Parallel collector is used.
Let’s look at each of these collectors.
Serial Collector
Serial collectors are almost extinct. Why ? They are suited for single processor machines (it uses one single thread). And I don’t know where I can find single processor Servers nowadays. I won’t recommend this collector as it cannot take advantage of multiple processors. If you still want to use Serial Collector, use the java command line option -XX:+UseSerialGC (and drop me a note on why you chose this collector)
Note that there are two survivor spaces. This is for efficiency sake. After each minor GC, one of the survivor space is always emptied and during the subsequent GC cycle, the survivor spaces switch roles. There is a number of times (determined by jvm) a surviving object can be copied before getting moved to the Tenured generation.
Parallel Collector
Parallel Collector makes use of the multi CPU servers by running multiple threads in parallel to perform GC. This greatly increases the efficiency of GC operation. It is the default collector in most architectures. Note that by default ONLY minor collections happen in parallel unless you explicitly specify -XX:+UseParallelGC java command line option. You definitely want Major collections to happen using multiple threads to reduce the GC overhead.
Note: Parallel Collector is also known as Throughput Collector
Note: You can use -XX:MaxGCPauseMillis= java command line option to specify maximum garbage collection pause time. With this option, HotSpot will try to adjust the Heap memory pool sizes to meet the max GC pause time (even though there is no guarantee that it will be met)
CMS Collector (Concurrent Mark and Sweep)
CMS collector is one of the two ‘Mostly concurrent Collectors’ offered by Oracle (the other being Garbage-First Garbage collector, discussed shortly). This collector attempts to do GC (or at least most of GC) while application is still running. In this way the GC pause times are greatly reduced (at expense of throughput). The overall throughput (number of requests processed per time interval) will be less than Parallel collector. But the GC pause time will be lower which makes it attractive for applications that cannot tolerate longer GC pauses (like Stock trading websites). You can enable CMS collector using java command line option -XX:+UseConcMarkSweepGC.
Garbage-First Garbage Collector
This collector is the latest innovation from Oracle to “have the cake and eat it too”. What I mean is, this collector strives to achieve both reduced GC pause time and increased throughput. Garbage-First collector divides the whole heap into multiple equally sized areas and runs a ‘mark’ phase across the entire heap. By doing this, it identifies the areas that are filled mostly with objects that can be collected (i.e garbage). It does this in a concurrent fashion while the application Threads are running. It then goes after the regions that are most likely to free up large amount of memory – this is where Garbage-First name comes from. In addition to this, G1C continuously works to reduce fragmentation. G1 Collector is enabled by using java command line option –XX:+UseG1GC.
Note that G1C is going to be the long-term replacement for the CMS collector. It is well suited for larger heap sizes (5GB+)
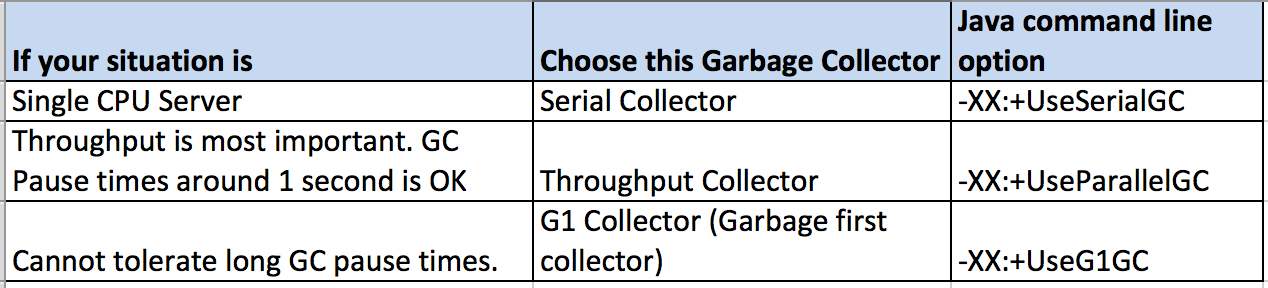
So, how do you choose the right collector ?
My first suggestion is to let JVM choose the collector for you. But if you believe the default collector is NOT helping, use the table below to choose the collector
Hopefully you learnt a thing or two by reading this far. You now understand various garbage collection algorithms very well. The verbose GC logs can be extremely helpful to uncover GC issues. For dealing with analyzing verbose GC logs, I have a series of posts that will be helpful to you. Check them out. And if you are moving to Java 1.8, see this important change that Oracle introduced in Java 1.8.
Good luck.
Very good concise explanation.
Is like to point out a few typos and grammatical errors:
1. … learnt a thing or two …
2. reminder -> remainder
Thanks much Vivek. I’ve updated the article.
Nice article. Keep investigating and posting.
Thanks Tejeswar. Will do 🙂
Nice article.. very helpful and easy to understand.
Excellent Article which discusses all Garbage Collectors.
According to G1GC – still, it trying to Mark the Regions which is Occupied by Objects then cleaning the dead Objects, my question is here is “Why it called as Gabbage First?”
And also I have observed G1 Collector utilizing more Heap memory(2.x times) compare to other collectors (of course achieving less major GC pauses, not much difference in minor GC collection )
Thanks
Hari
Thanks, Hari.
It is called G1 (Garbage first) because the collector goes to work on heap regions that are least likely to have live objects (i.e more garbage). The JVM knows this because it divides the Heap into regions when the JVM starts up, and allocates objects in these regions.
Hope this clarifies.
Thanks got it.
Any idea why G1 taking more Heap memory compare to other collectors ?