Glad you are here. It’s time to take a deeper look at all the various monitoring metrics that AppDynamics provides. We have so far done the following:
- Installed AppDynamics Controller
- Installed a sample application (Node.js,REST and mysql) and installed appdynamics agent
- Ensured the application shows up in the controller UI.
Note that we have not customized any monitoring elements yet. i.e whatever we are going to see is out-of-the box, which is one of the coolest things about AppDynamics. Let’s start.
How to view the Flow Map of the Application ?
Application flow map provides an excellent view of the data flow of the application. AppDynamics automatically tracks all the inbound and outbound calls of the instrumented application and attempts to draw this flow map. It is like an interactive Visio Diagram of the application infrastructure architecture that you did not create. (AppDynamics created it for you). Let’s take a look at the Flow Map of the sample application we have instrumented.
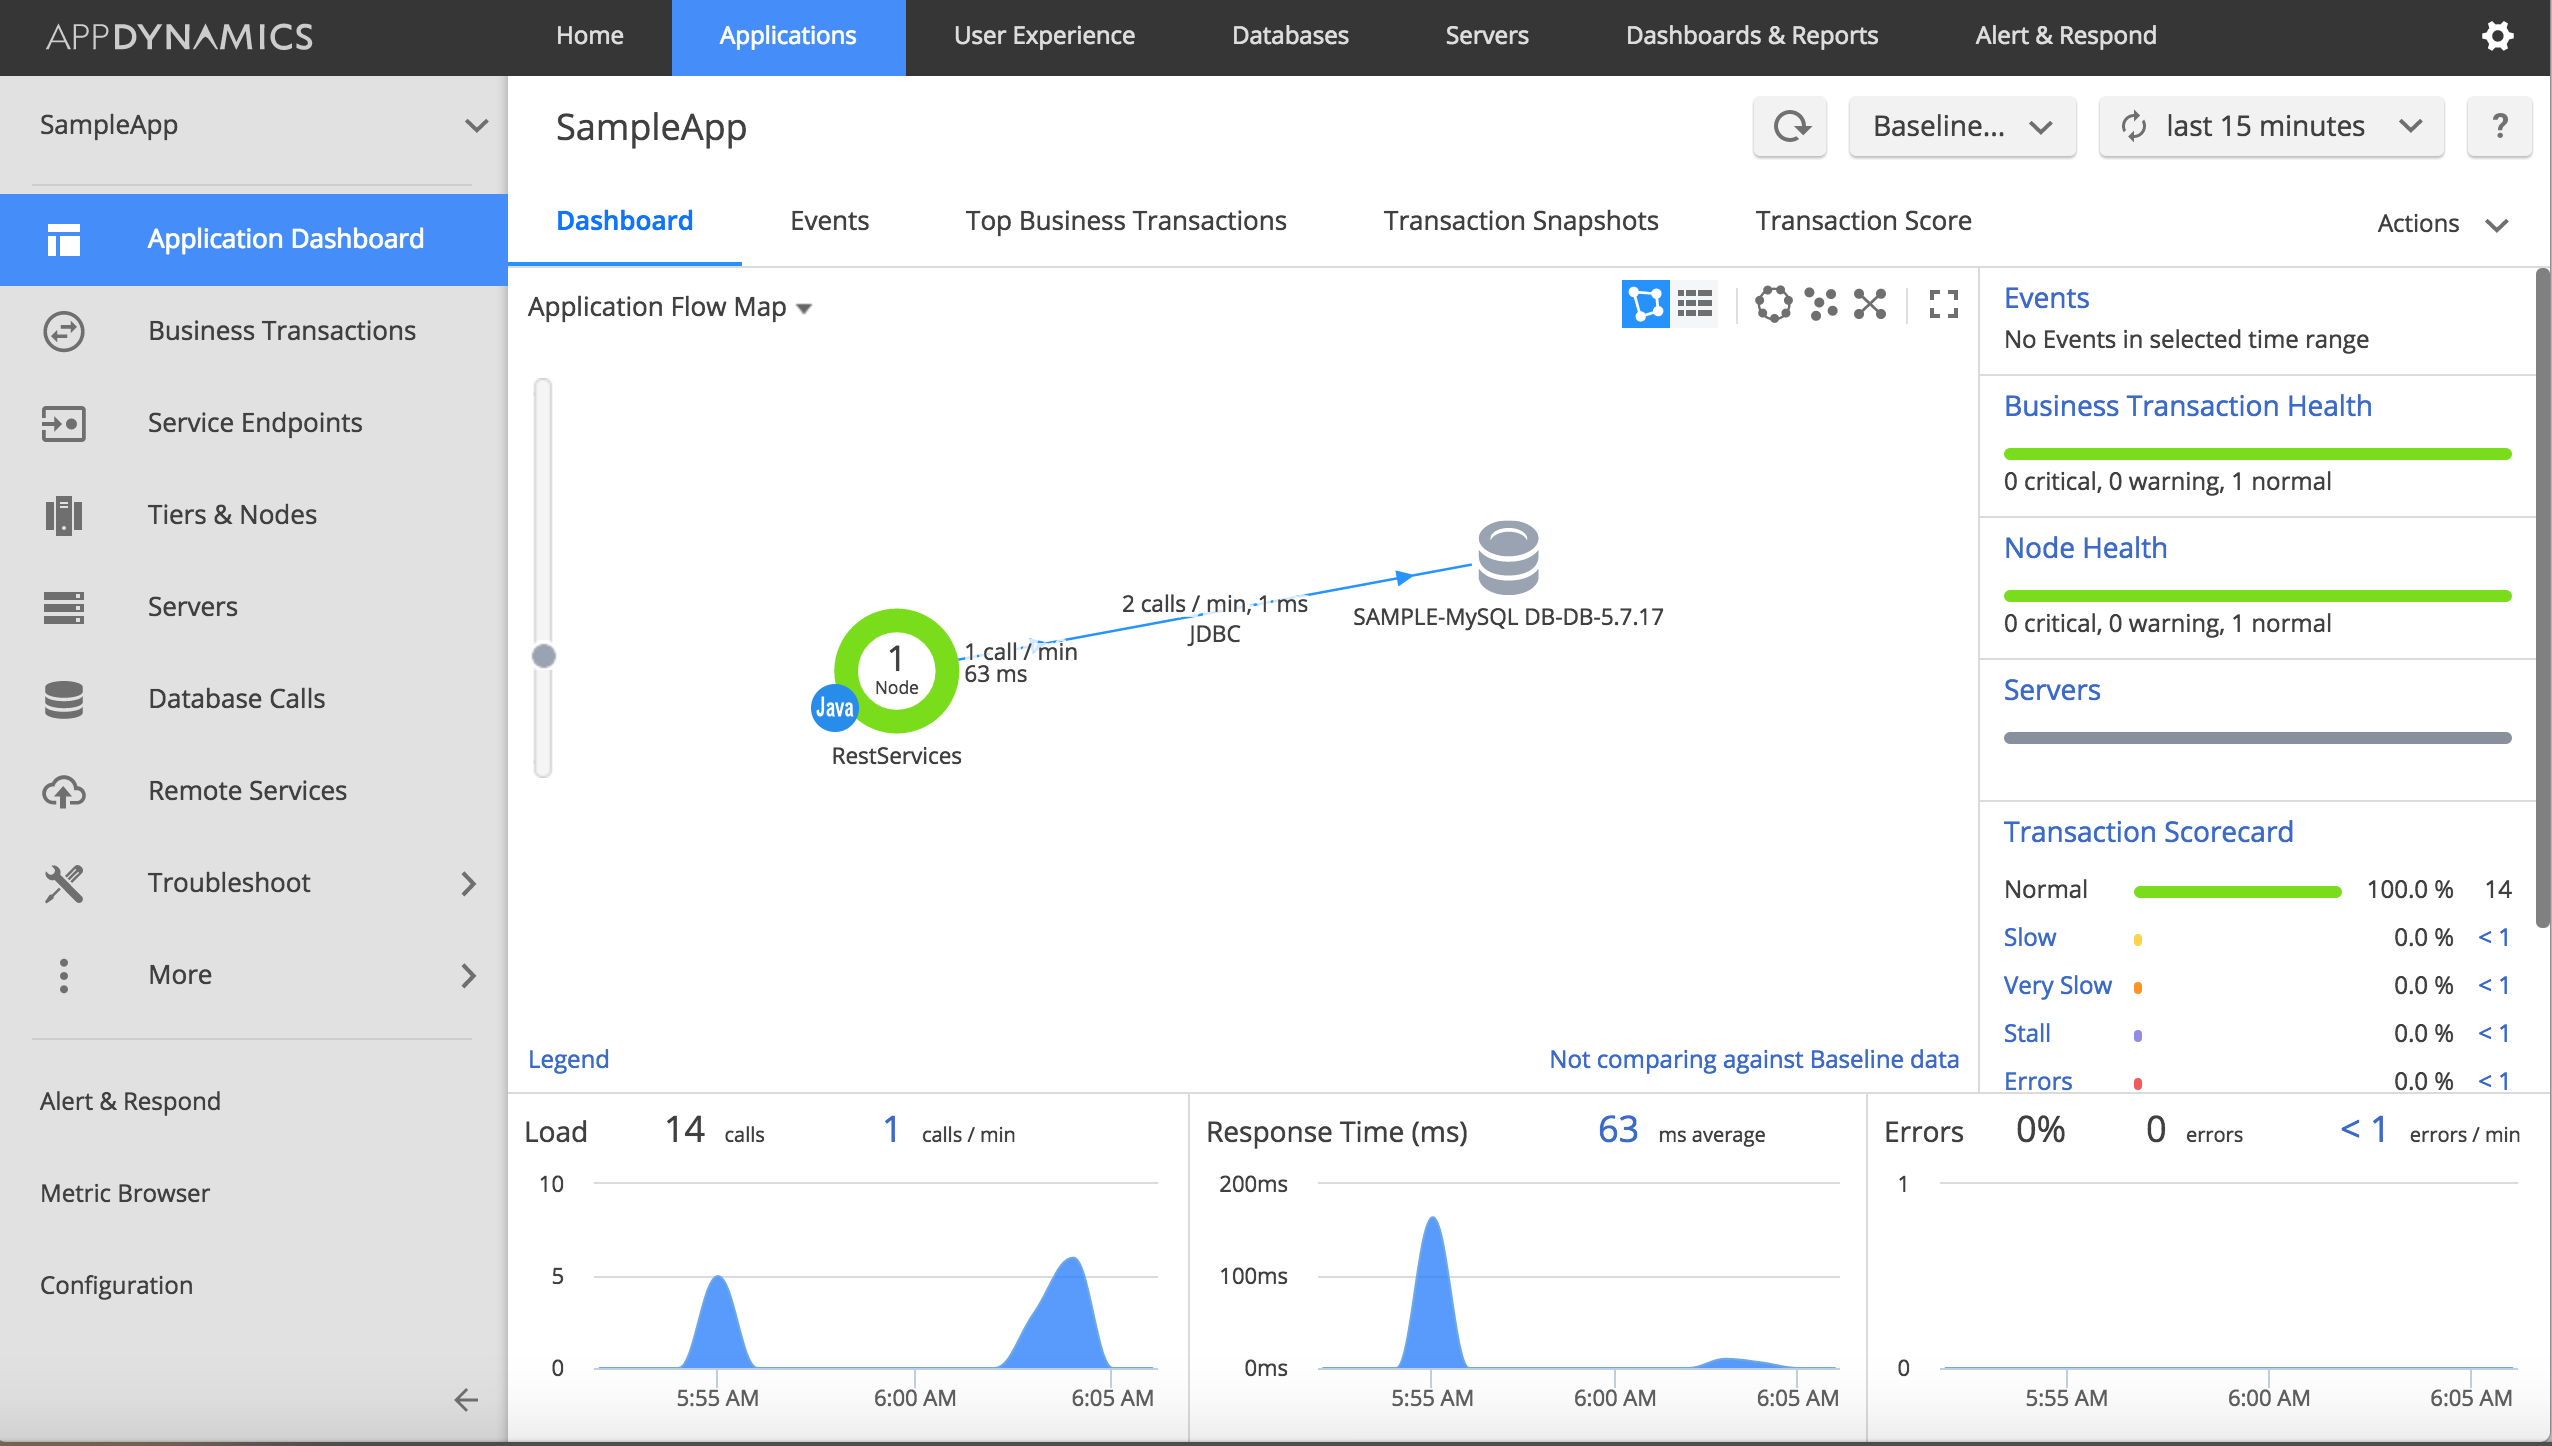
Few pointers about the Flow Map:
- You can drag any element in the Flow Map to create a better view for you
- You can zoom in and out using the slider at the left
- You can redraw the flow map using various layouts using the buttons at the top right (circular layout, Auto layout, etc)
- You need to have few transactions occured before Appdynamics creates this flow map. For example, if there were NO mysql database calls, AppDynamics would not have drawn the MySQL backend (as it would not have detected the database yet)
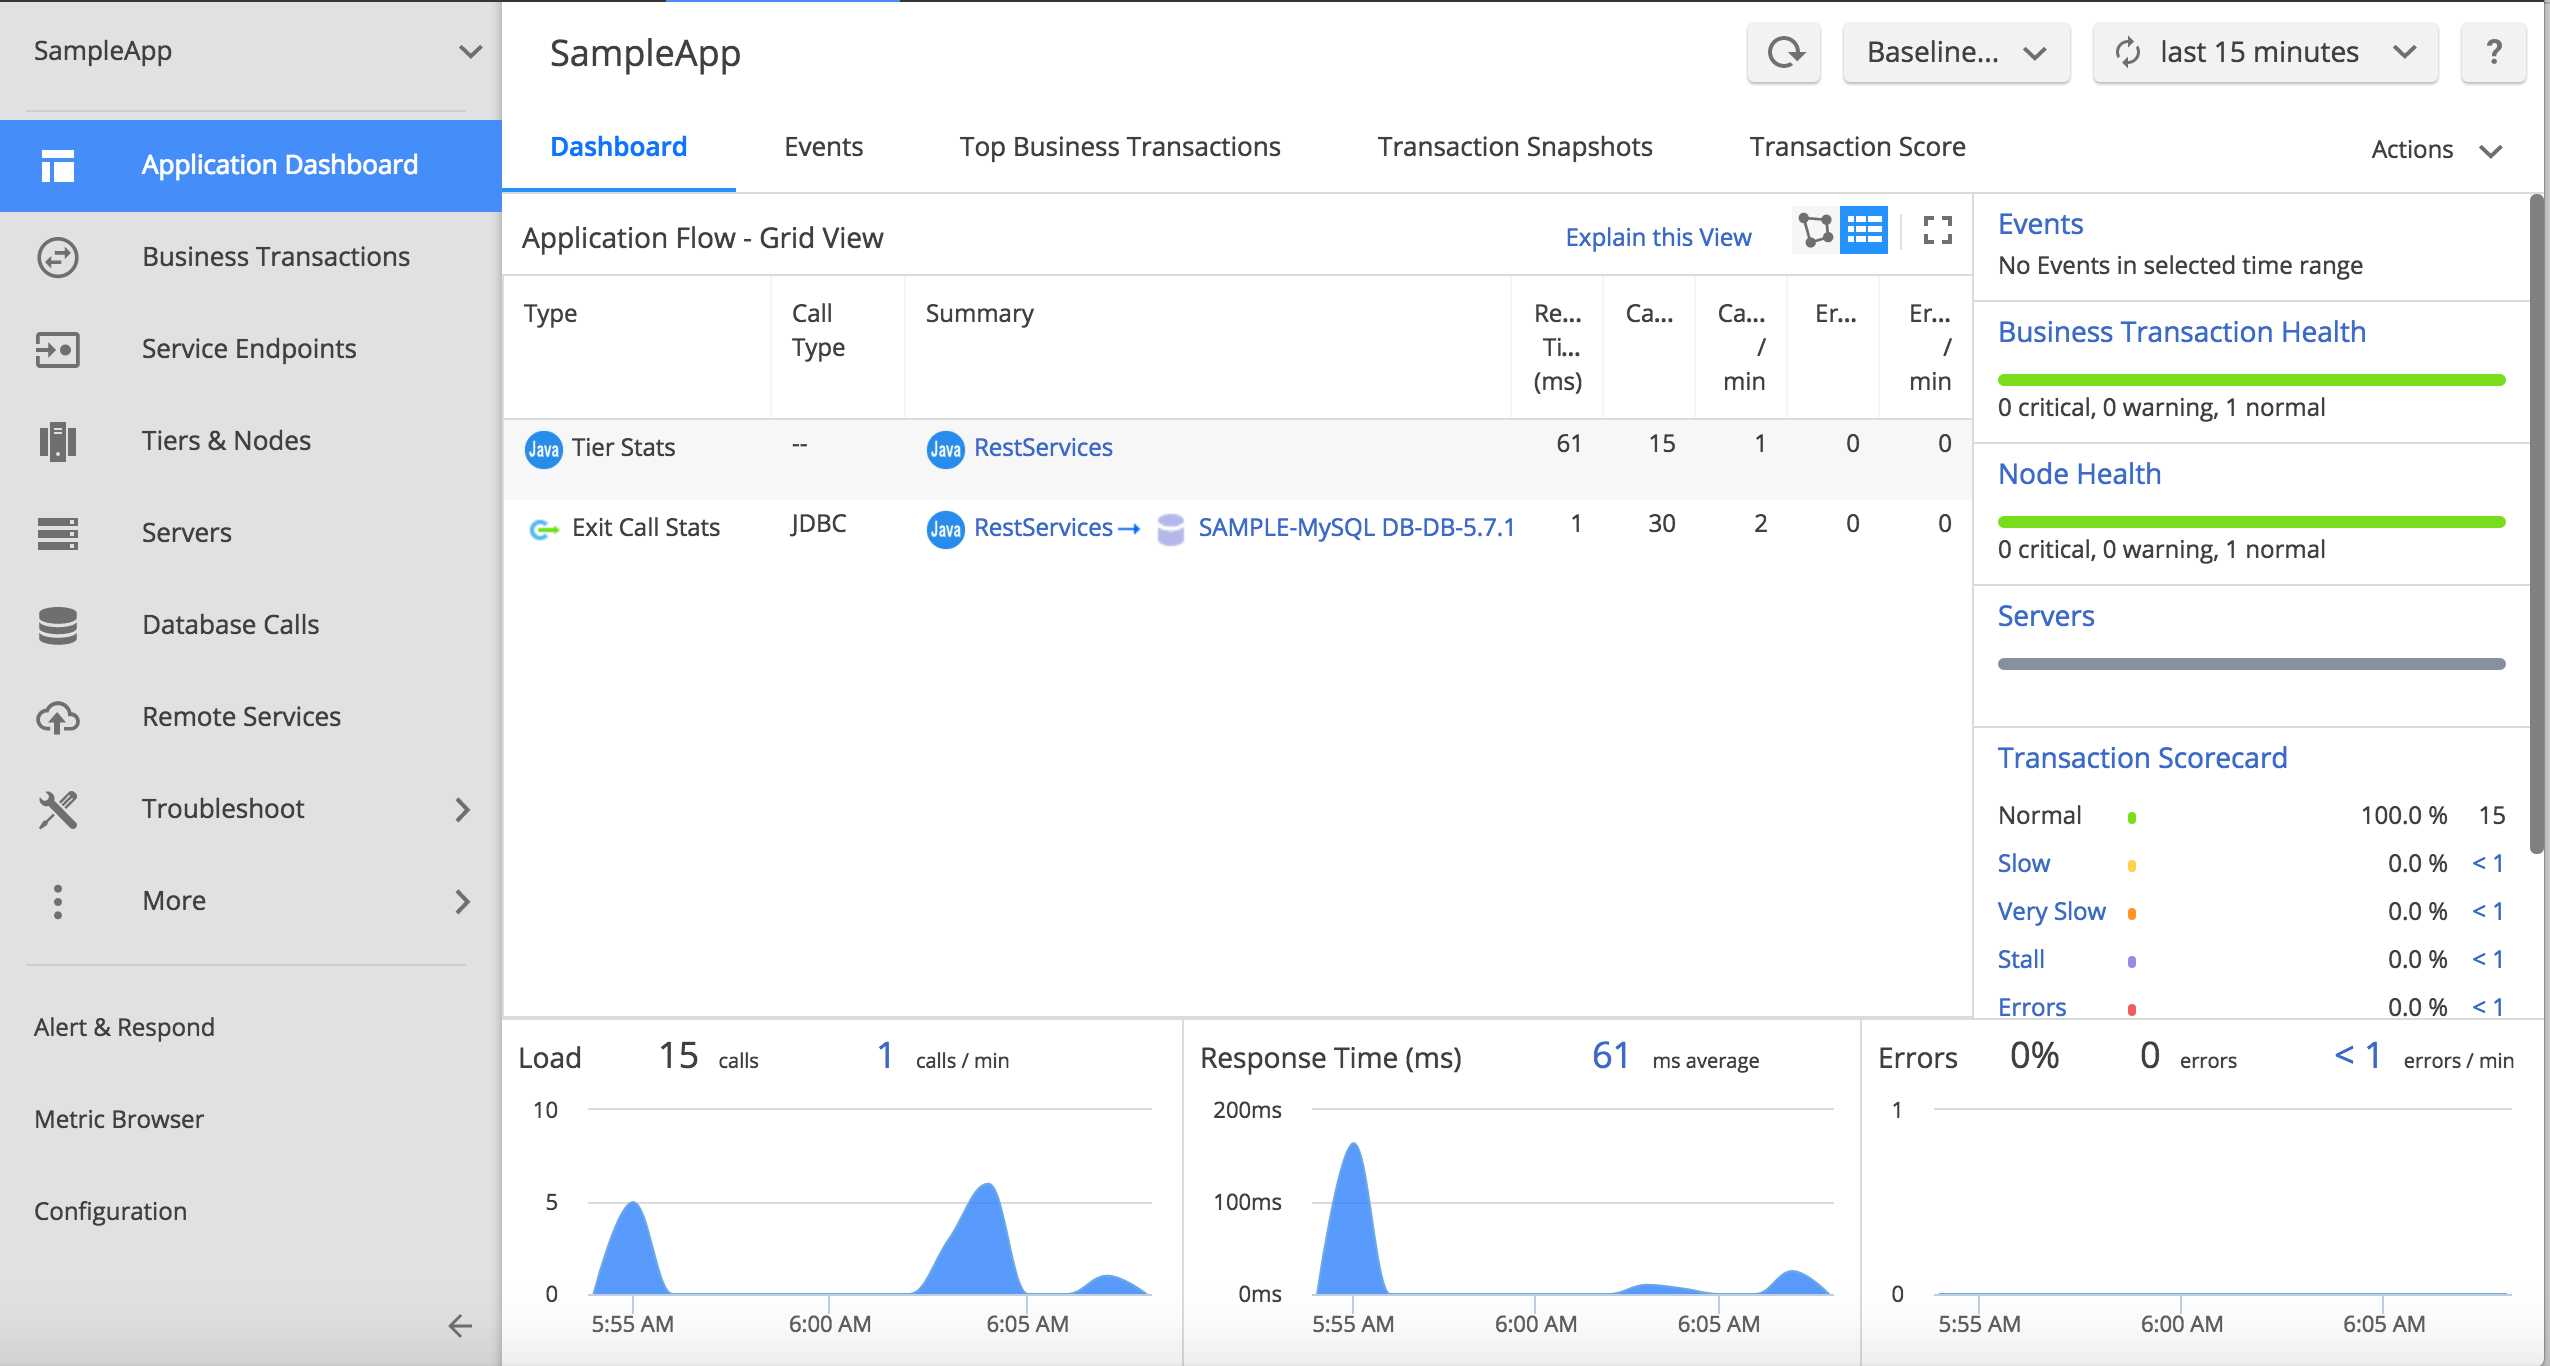
For not-so-graphically-inclined souls out there, there is a grid view. Click on the grid view icon at the top left in the Flow Map area and you will see a nice table style view.
Tip:
In complex applications involving multiple backends, you may be surprised to discover certain backend systems (such as a web service call to a remote system that you did not anticipate) being used by your application. This is extremely useful as you may uncover potential issues with the architecture of the application.
Historic monitoring data:
This is one of the powerful features of any APM solution. Storing historic monitoring data for analysis. AppDynmics does a great job of storing and retrieving historic data. It stores the data in a local mysql database on the Controller. You can click on the drop down at the top right (which reads last 15 Minutes) to choose your time frame
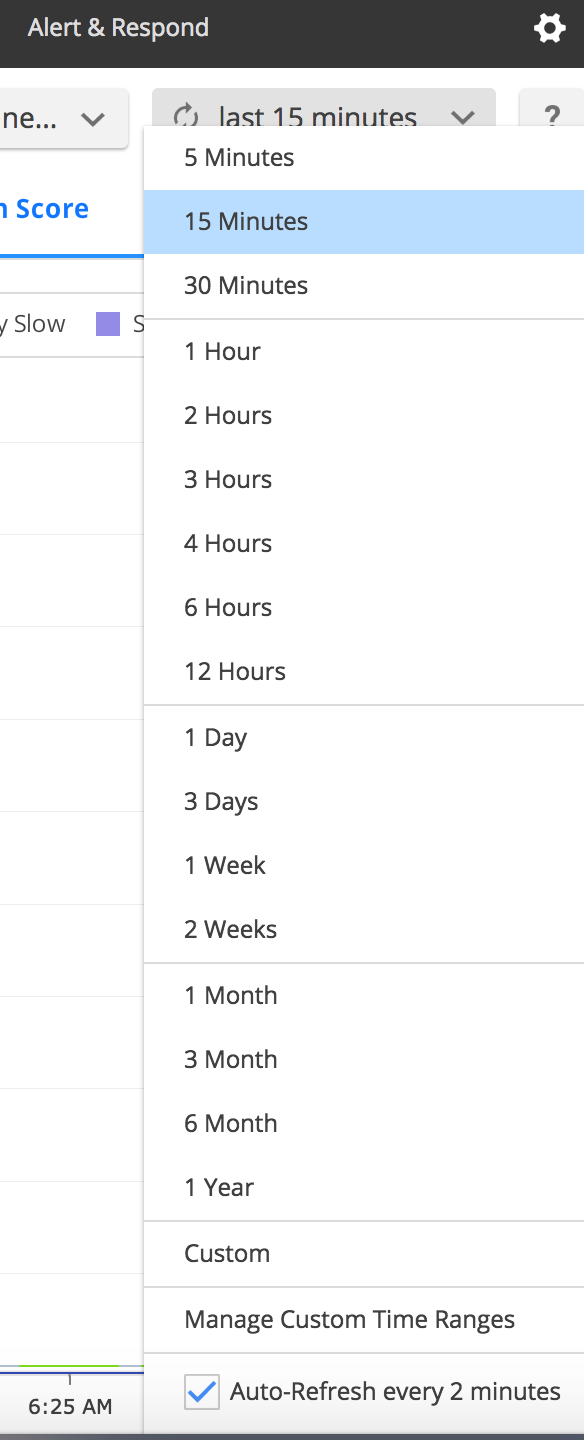
Note that Events,Snapshots and incident data will be retained only for 2 weeks. All metrics will be retained for 1 year (with decreasing granularity as the data gets older).
How to view the current throughput of the Application ?
Throughput is a significant monitoring metric. It tells you the number of calls to the application in a given interval. This is also known as load of your application. If you ever run into any performance issues with your application, throughput is one of the first monitoirng metrics you should be checking (perhaps there is a surge in the number of users, or worse – a Denial of Service attack). AppDynamics readily reveals througput right in the home page of the Application.
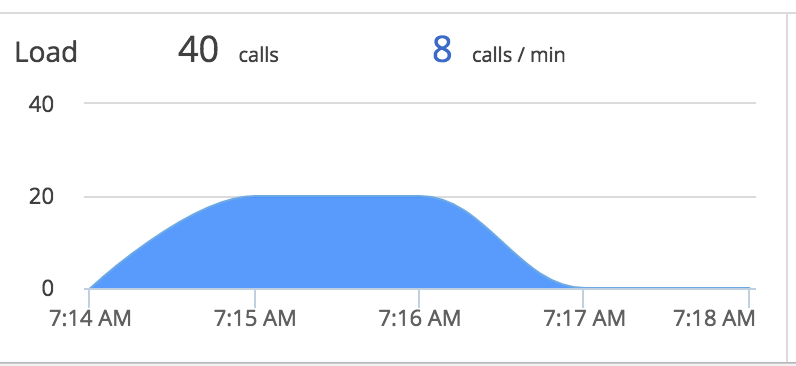
Note: I used apache jmeter to create some load on the SampleApp. Jmeter is a great tool to create load and capture the results. You can also do the old fashioned way by simply hitting http://localhost:8080/SampleApp/products multiple times from your browser.
How to view the current respone time of the Application ?
Equally important to the Throughput is the Response time of your application. Let’s face it – the whole reason we are doing all this is to make sure your application is performing well i.e responding to user requests at reasonable time. AppDynamics readily reveals the response time in the home page of the Application Dashboard.
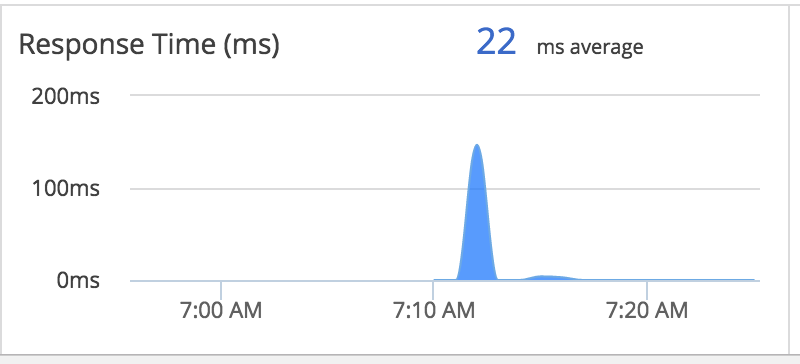
How to view Database backend reponse times for your Application ?
Now we are talking. Without a modern APM tool, how in the world you can tell, from Application persective, Database is responding ? You could perhaps add some debug logging in your log file. Good luck with that. But AppDynamics saves the day. It automatically captures backend response times. It recongizes most Databases (Oracle, SQL Server, MySQL etc).
In our SampleApp, all you have do is double click on the MySQL Database from the Application Flow and you will see the Database Dashboard
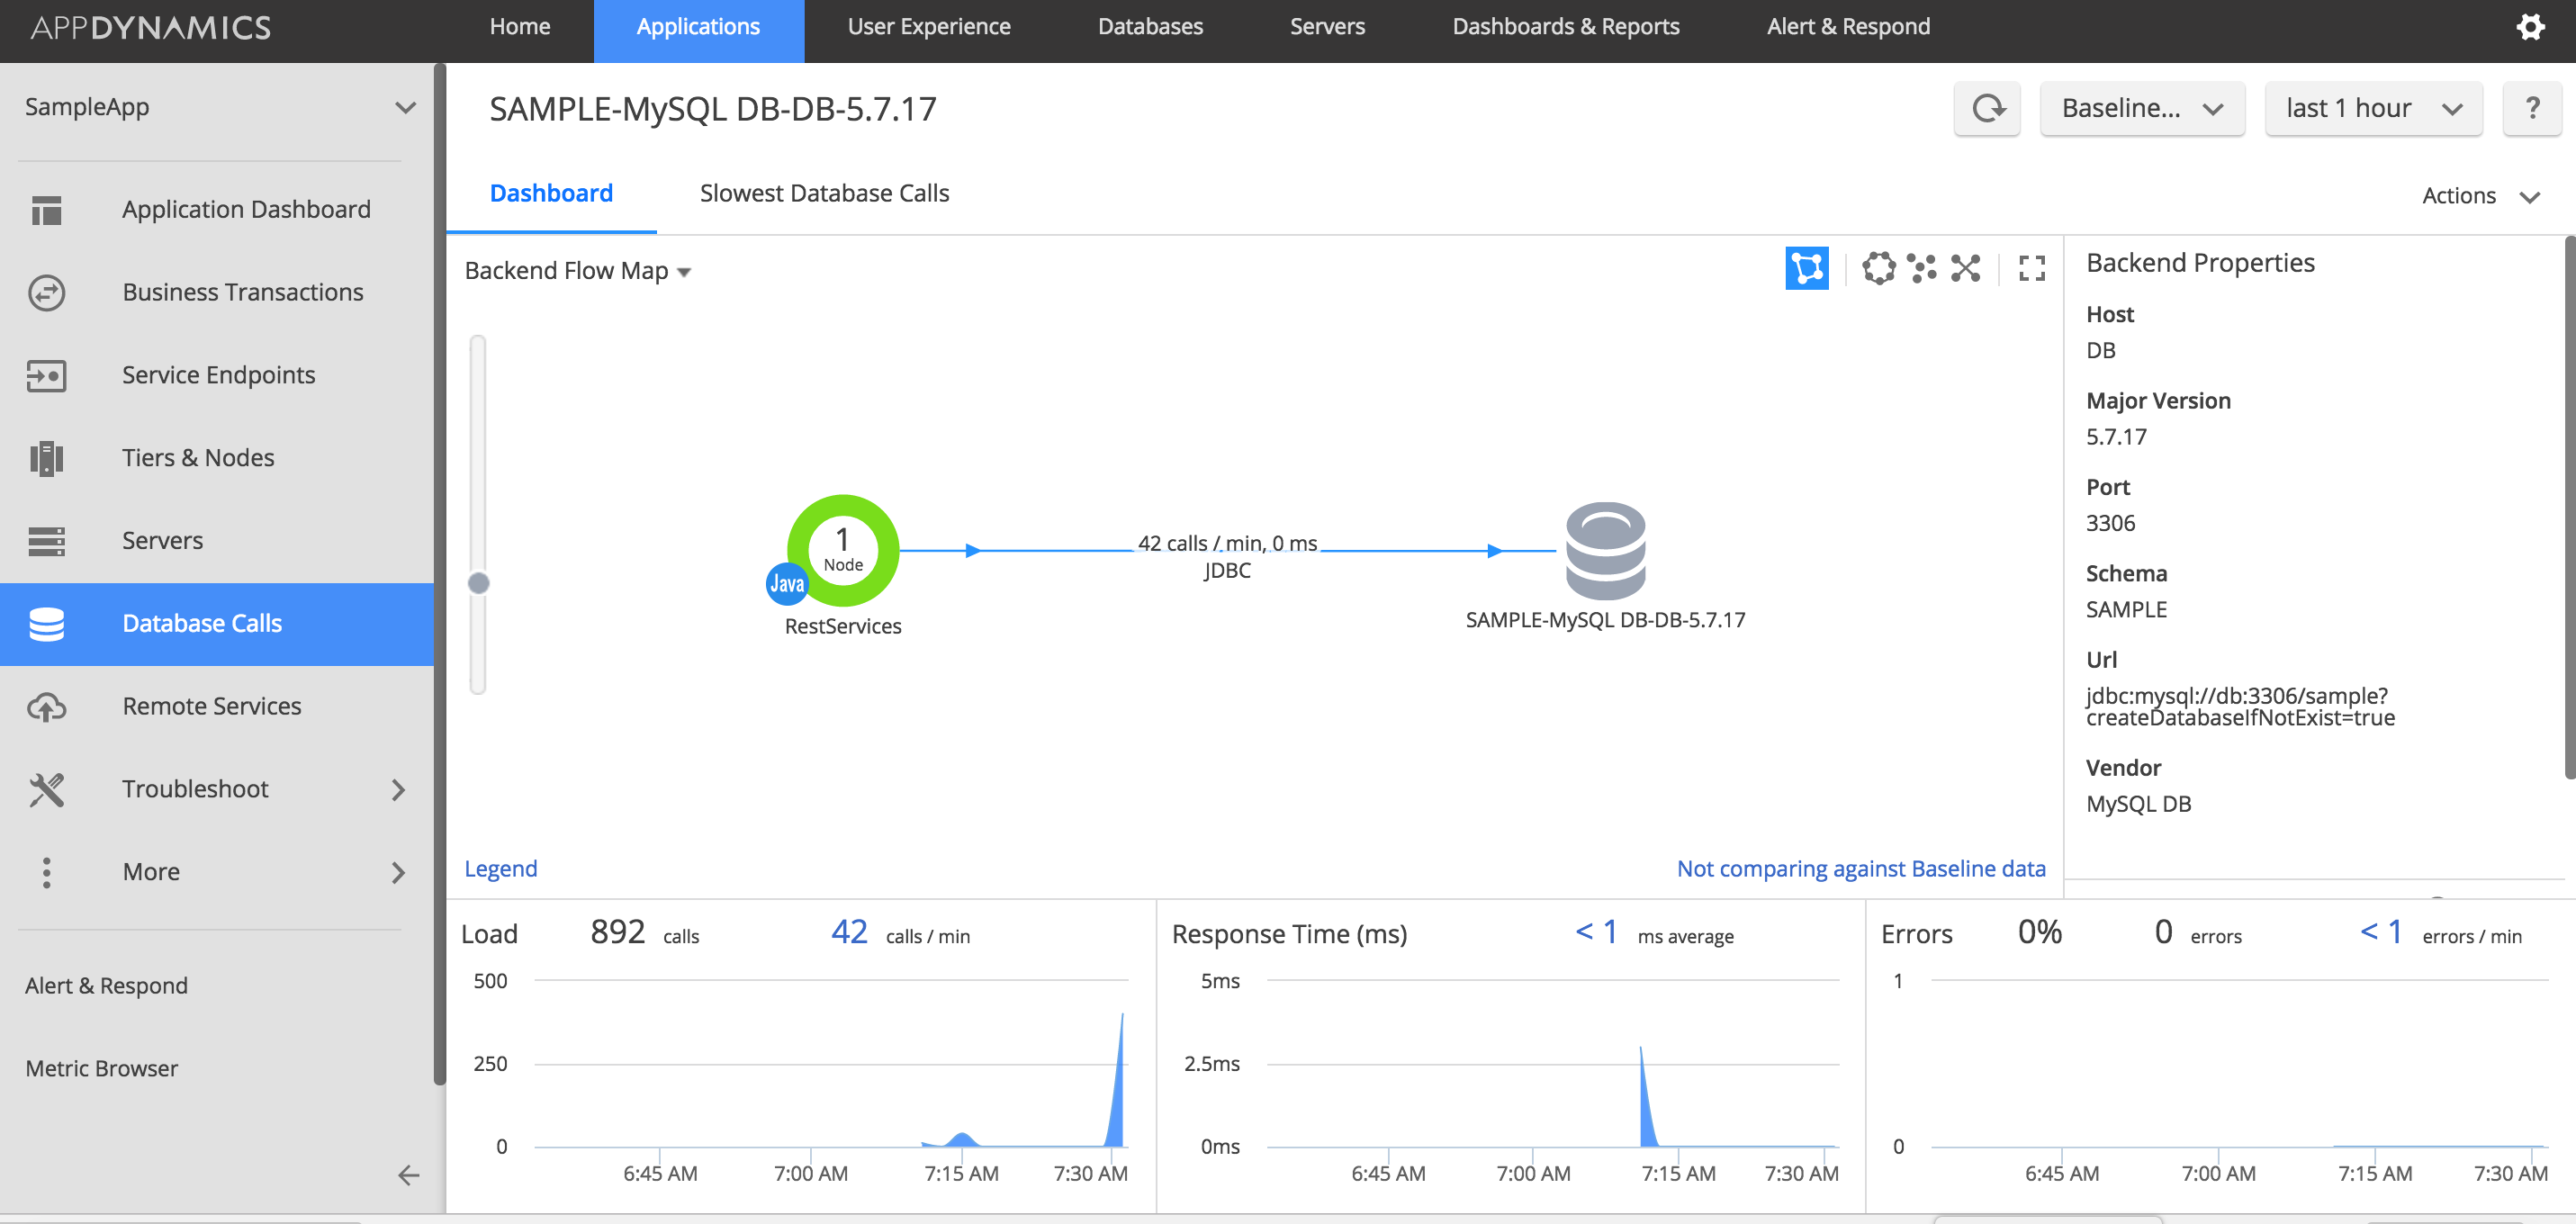
Look at the Backend Properties data it pulls. Do you honestly know the full Database version of your backend database ? There it is right there. It gets even better. See below.
How to view slowest Database calls ?
Money. Let me tell you this. Revealing slowest Database calls in a given application is worth Kilos of gold. If you are an Application Support guy, this is where you become Application Support Guru. AppDynamics makes this a breeze. Just click on the Slowest Database Calls tab and there it is.
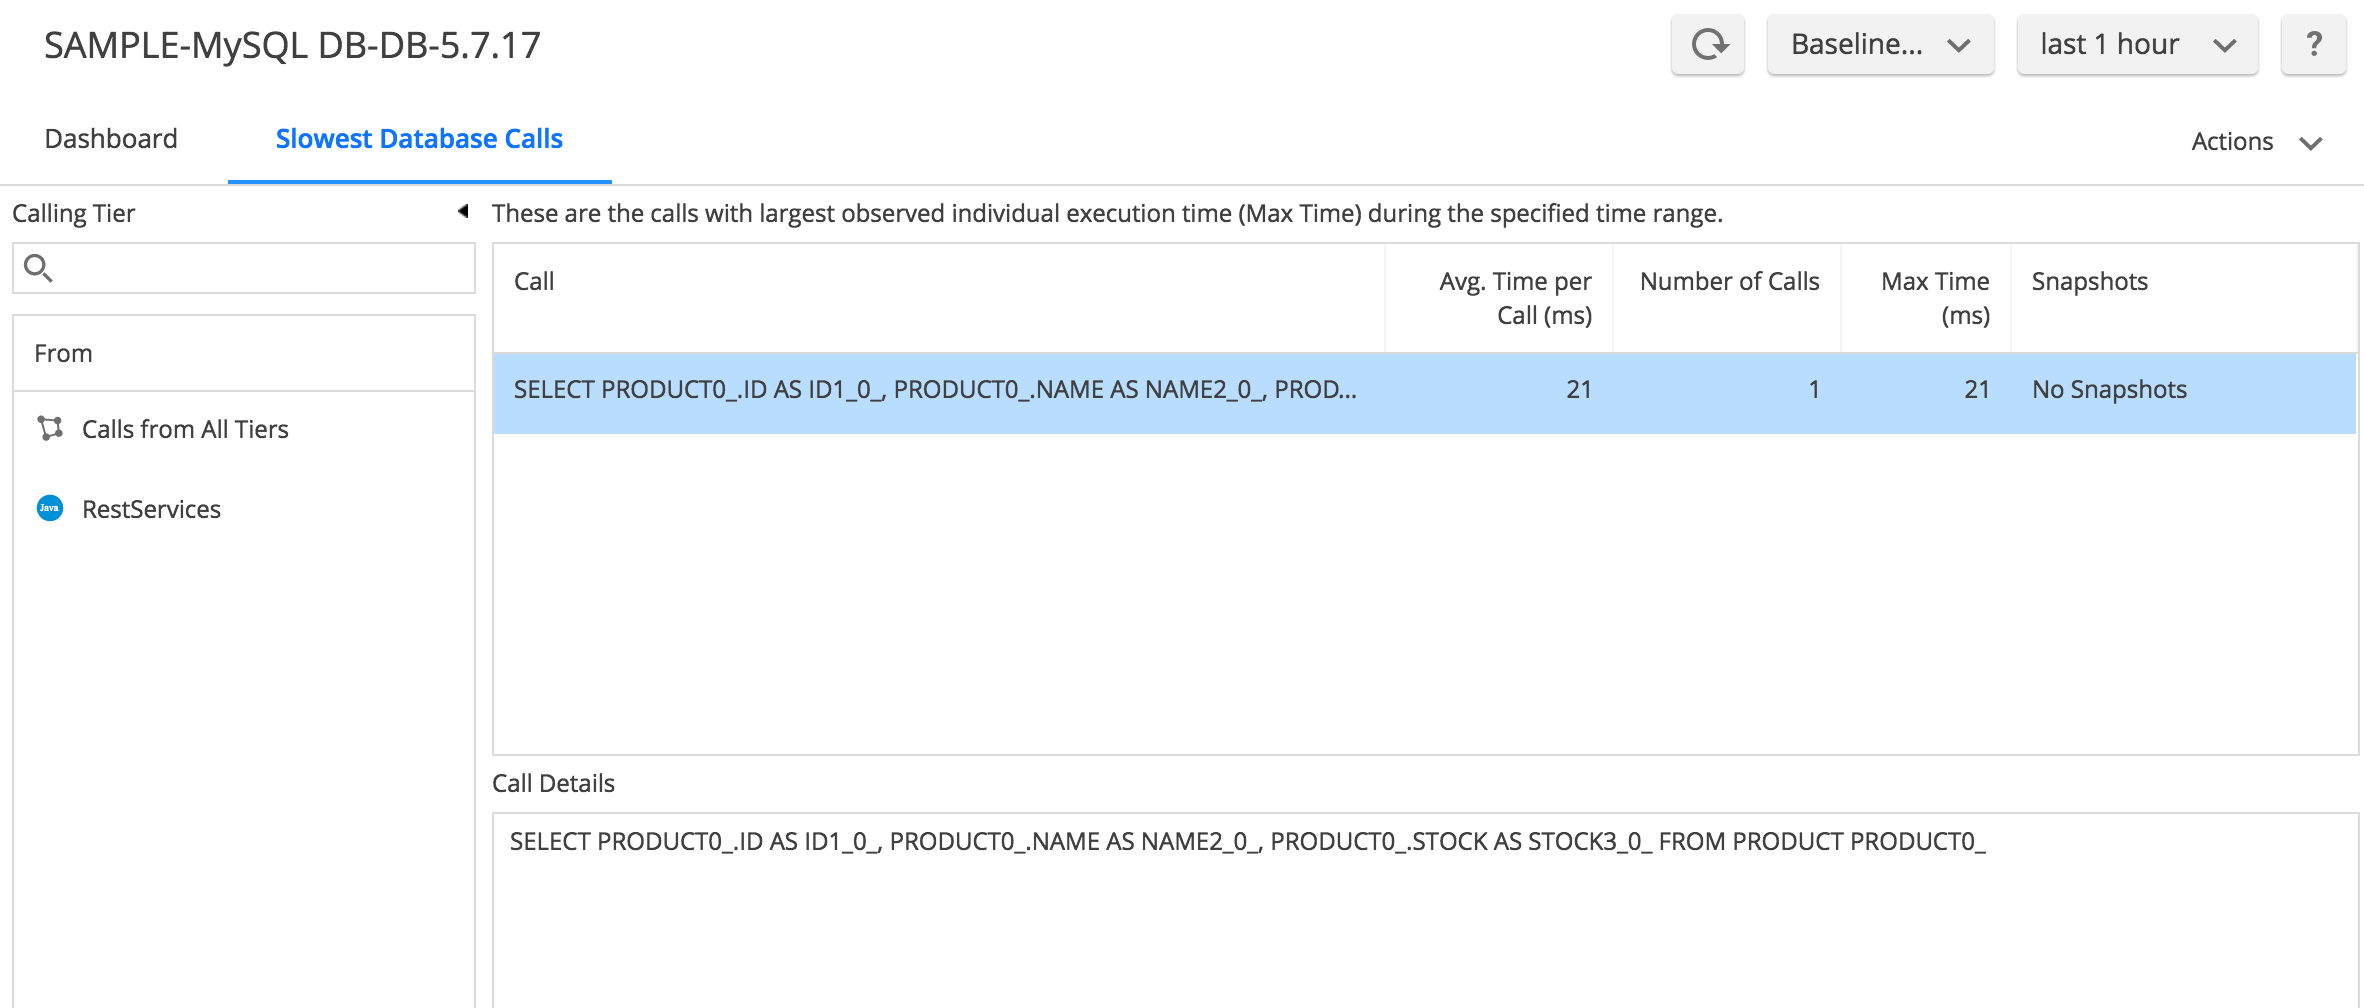
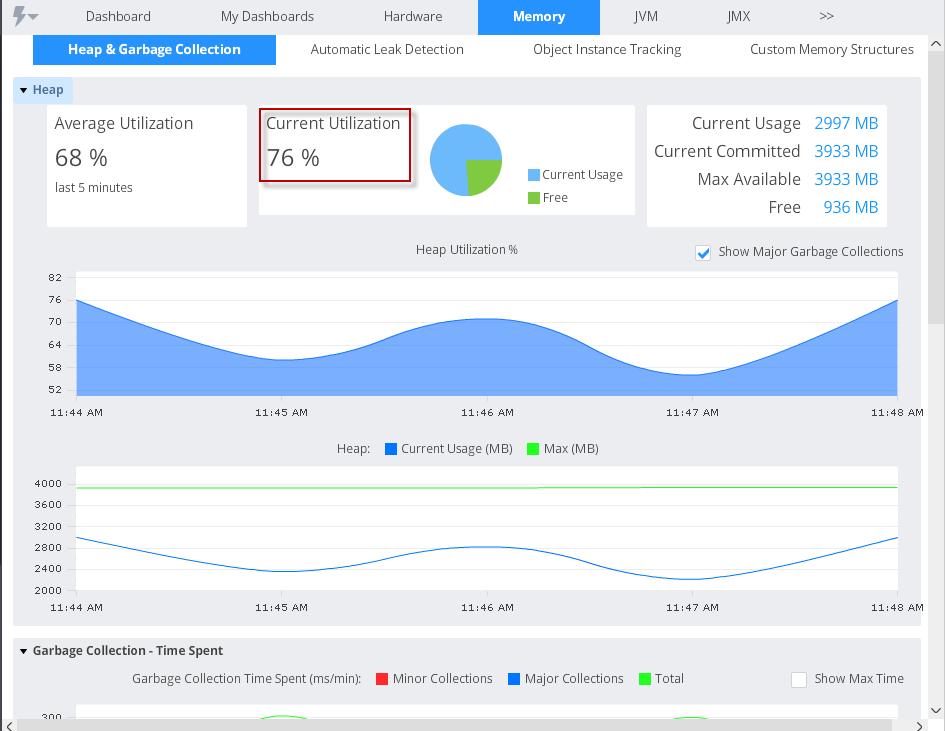
How to view Java Heap utilization and Garbage Collection metrics of your Application ?
Java Memory issues can be dreadful. Whole book can be written on just Troubleshooting Java Memory issues. But when you have the right data, your job will be much much easier. AppDynamics goes above and beyond with helping you troubleshoot memory issues. In order to view Memory metrics, just click on Memory tab of your Application Server.
For a deep-dive into memory monitoring using Appdynamics, see my other post http://karunsubramanian.com/websphere/troubleshooting-java-memory-issues-using-appdynamics-part-1/
There you have it. Appdynamics has numerous features to aid in supporting the your application. I myself keep finding interesting new use of Appdynamics quite often. The information in this article is pretty basic but critical to understand and put to use.
Happy Monitoring!
