So you have installed AppDynamics Controller, instrumented a simple Java Application and even viewed it from AppDynamics Controller UI. You have come a long way. Excellent work! In this blog post, I’ll take you a step further by showing you how to view critical Application Metrics in the UI. In order to get to see various monitoring metrics, let us use a more sophisticated application (one with a backend database).
Fortunately a sample application is available at github specifically for this purpose. Kudos to the developers who made this available to all of us. The application is based on Docker (no surprise there) so you need to have Docker installed in your server that you are planning to use as the Application host. If you don’t want to go this route, simply instrument one of your applications (preferably in Dev environment).
Here are the steps to install the docker based sample application.
- Clone the git repo
git clone https://github.com/Appdynamics/SampleApp.git
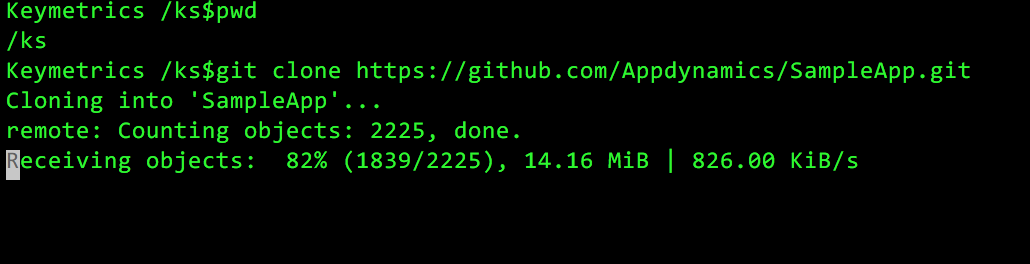
2. The command above creates a directory named SampleApp. cd to this directory and edit docker-compose.yml.
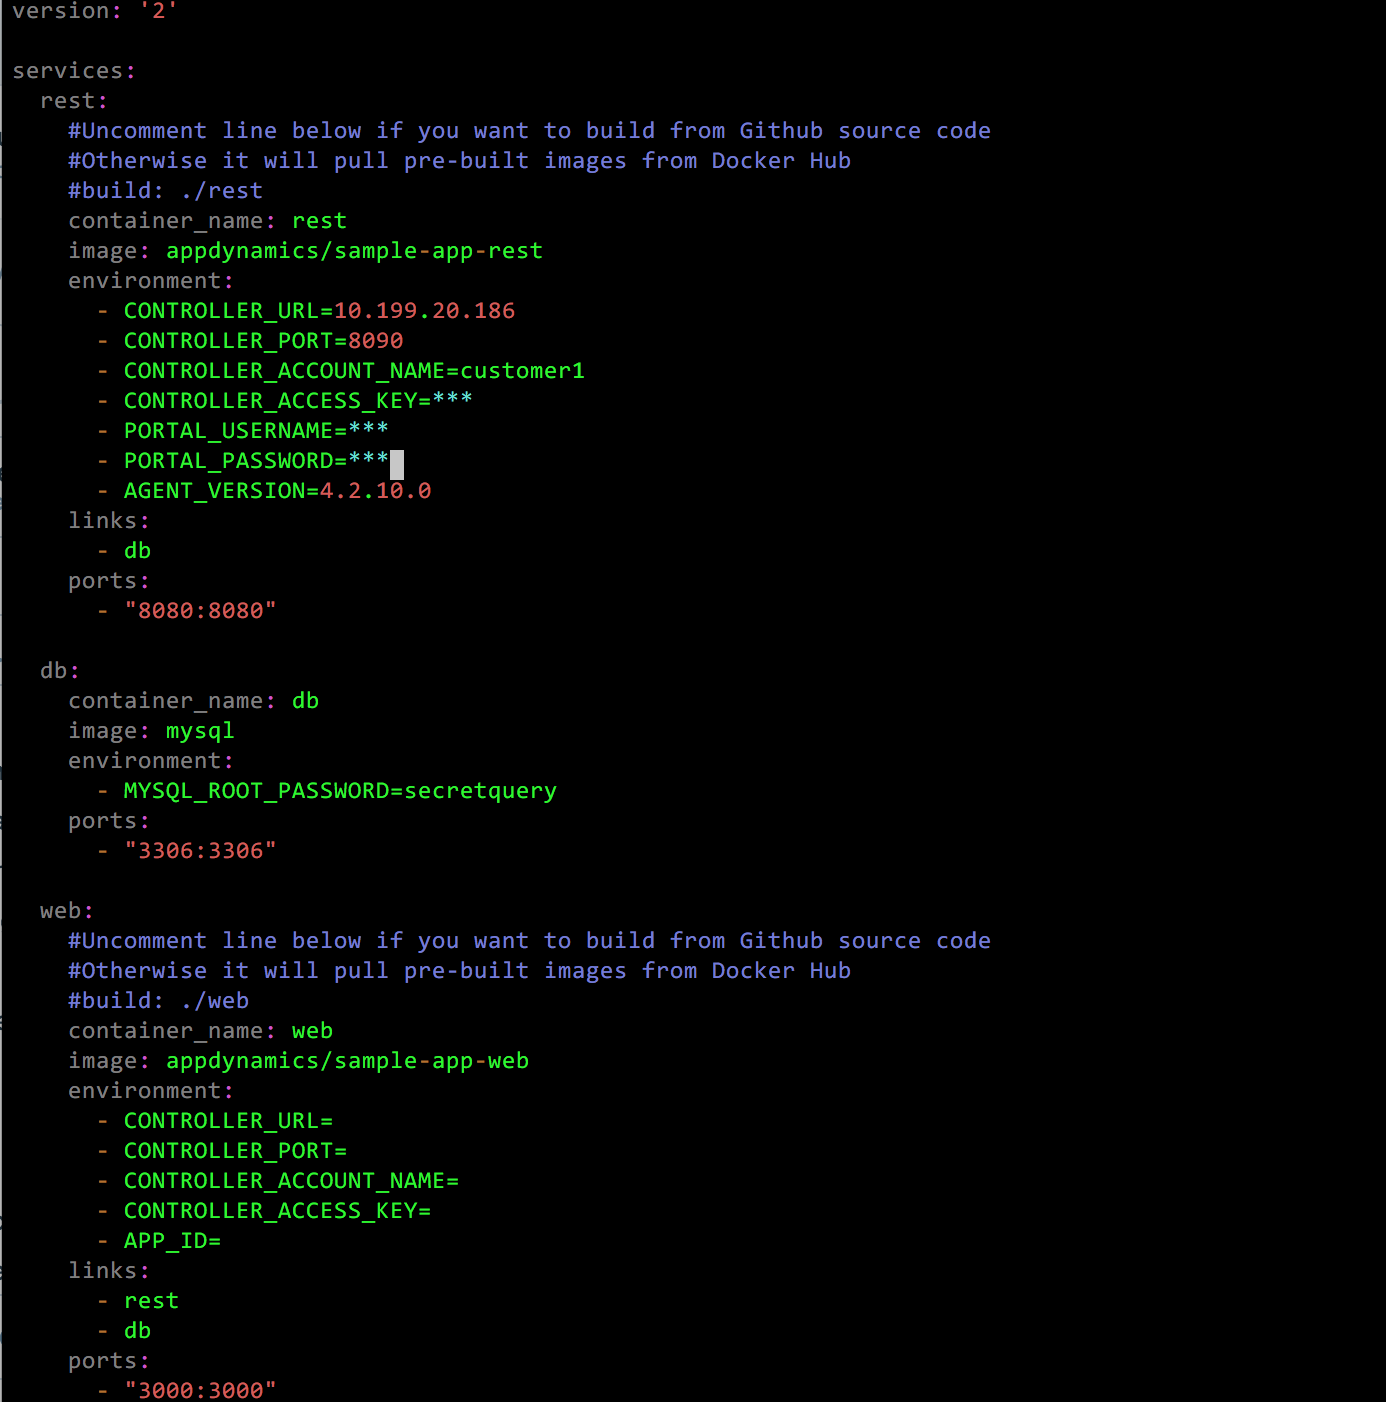
You need to supply the information in the environment block of the file. Save it.
3. Now run the docker-compose command (make sure you are in the SampleApp directory when running this command)
docker-compose up -d
up – Creates the containers and starts them
-d – starts the containers in detached mode so that the container runs in the background
Note: docker-compose command builds and runs multiple containers based on a configuration file (the yml file).
The above command may take several minutes to complete. You will see tons of log messages pertaining to pulling images from internet repositories. Be patient.
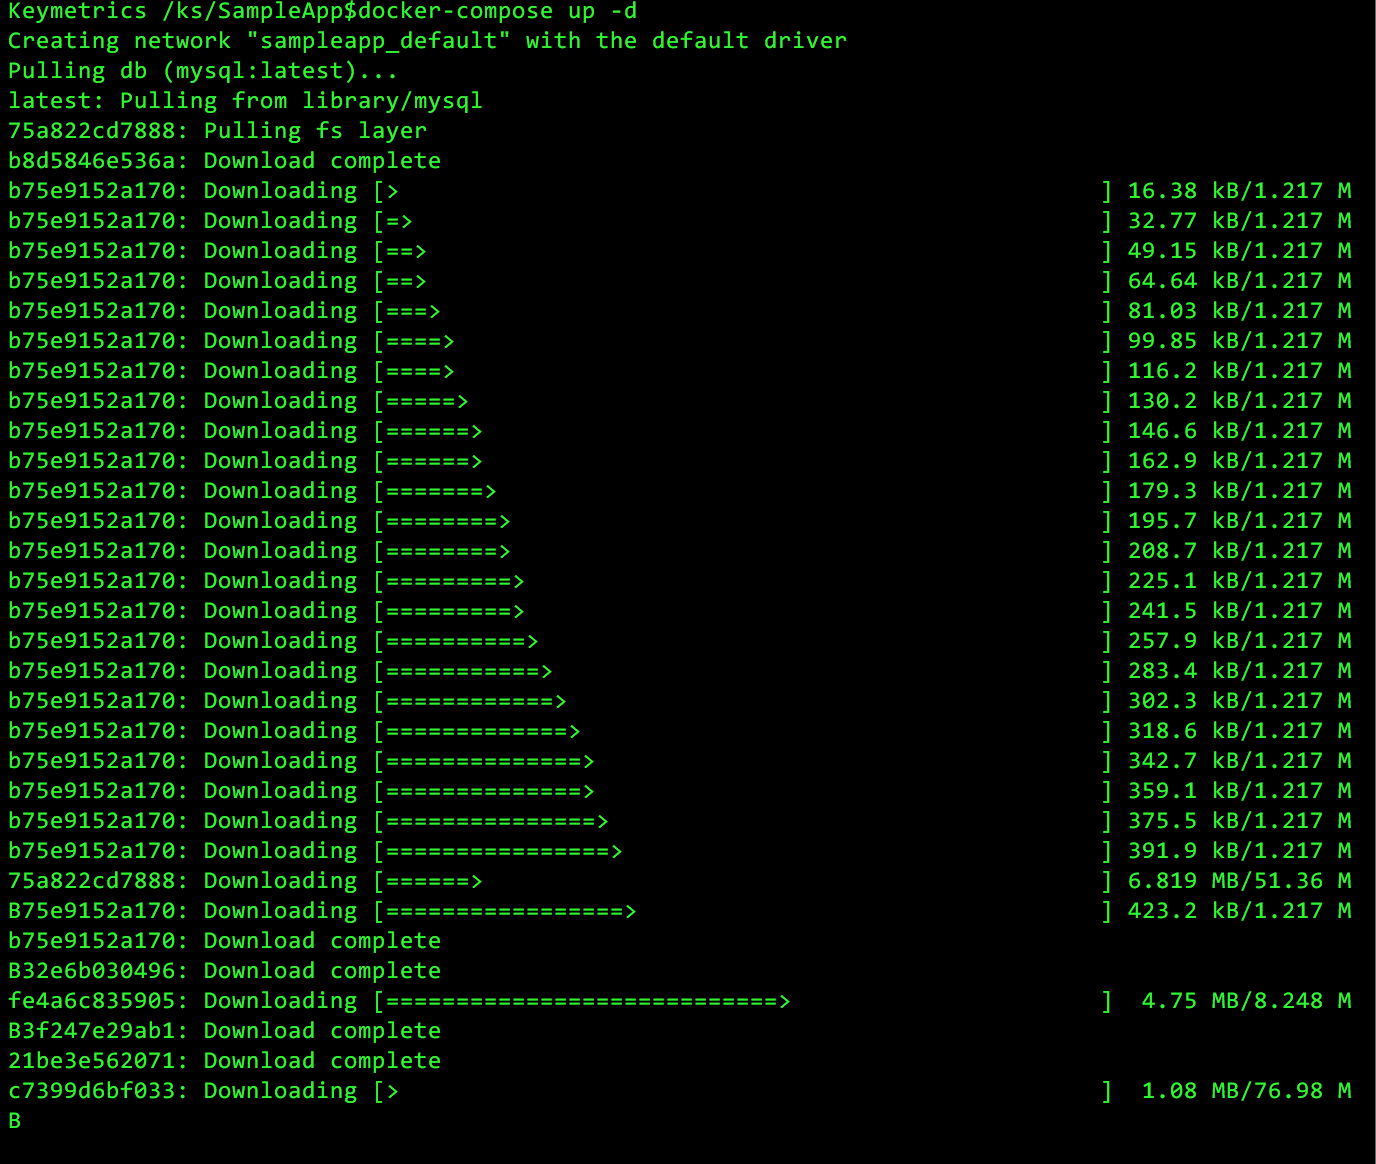
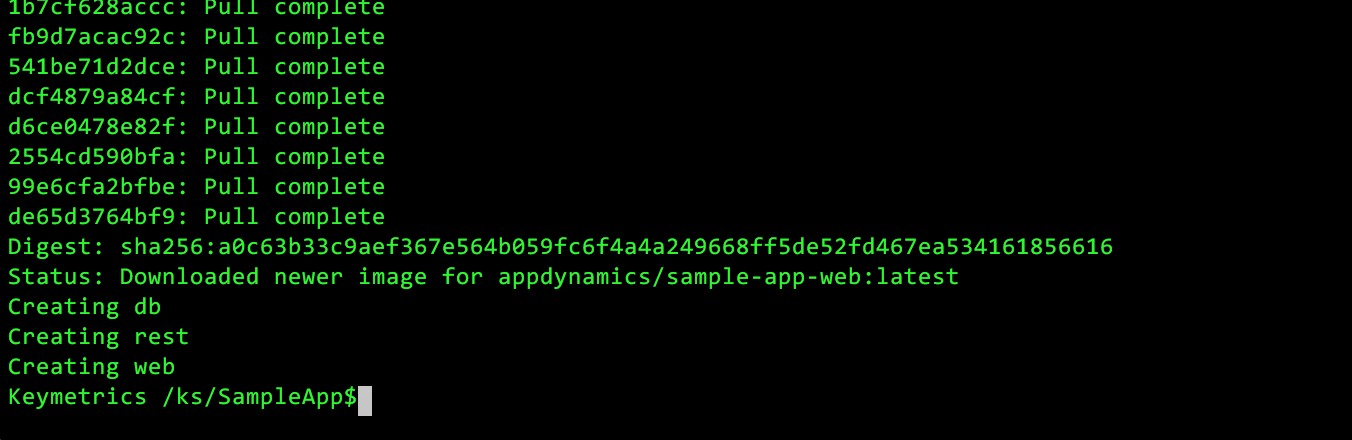
At the end, you will see output similar to the following:
4. Nice going. Now run the following command to install appdynamics agent start the application.
docker exec -it rest install-appdynamics;docker exec rest start-all
Keymetrics /ks/SampleApp$docker exec -it rest install-appdynamics;docker exec rest start-all
*****************************************************
Using Controller properties from docker-compose.yml
 Controller URL = http://localhost
 Controller Port = 8090
 Account Name = customer1
 Access Key =
*****************************************************
Downloading Agents from AppDynamics Portal with User:
Downloading https://aperture.appdynamics.com/download/prox/download-file/sun-jvm/4.2.10.0/AppServerAgent-4.2.10.0.zip
Downloading https://aperture.appdynamics.com/download/prox/download-file/db/4.2.10.0/dbagent-4.2.10.0.zip
Downloading https://aperture.appdynamics.com/download/prox/download-file/machine/4.2.10.0/MachineAgent-4.2.10.0.zip
*****************************************************
SSL is off
*****************************************************
Installing App Server Agent to /tomcat/appagent...
*****************************************************
Installing Database Agent to /dbagent...
*****************************************************
Installing Machine Agent to /machineagent...
*****************************************************
AppDynamics Agent configuration saved to /env.sh
*****************************************************
Starting Machine Agent with system properties: -Dappdynamics.controller.hostName=http://localhost -Dappdynamics.controller.port=8090 -Dappdynamics.controller.ssl.enabled=false -Dappdynamics.agent.applicationName=SampleApp -Dappdynamics.agent.tierName=RestServices -Dappdynamics.agent.nodeName=RestNode -Dappdynamics.agent.accountName=customer1 -Dappdynamics.agent.accountAccessKey=
To view Machine Agent log output: docker exec -it rest tail-machine-agent
*****************************************************
Starting Database Agent with system properties: -Dappdynamics.controller.hostName=http://localhost -Dappdynamics.controller.port=8090 -Dappdynamics.controller.ssl.enabled=false -Dappdynamics.agent.accountName= customer1 -Dappdynamics.agent.accountAccessKey=
To view Database Agent log output: docker exec -it rest tail-db-agent
*****************************************************
Starting Tomcat and Java Agent with system properties: -Dappdynamics.controller.hostName=http://localhost -Dappdynamics.controller.port=8090 -Dappdynamics.controller.ssl.enabled=false -Dappdynamics.agent.applicationName=SampleApp -Dappdynamics.agent.tierName=RestServices -Dappdynamics.agent.nodeName=RestNode -Dappdynamics.agent.accountName=customer1 -Dappdynamics.agent.accountAccessKey=
To view App Server Agent log output: docker exec -it rest tail-java-agent
*****************************************************
The Sample App REST services are running at: http://192.168.99.100:8080/SampleApp/products
The Sample App web application is running at: http://192.168.99.100:3000/#
5. That’s it. Log on to your Controller UI and bring up the AppDynamics Agents page (Click on the Gear icon at the top right and select AppDynamics Agents.)
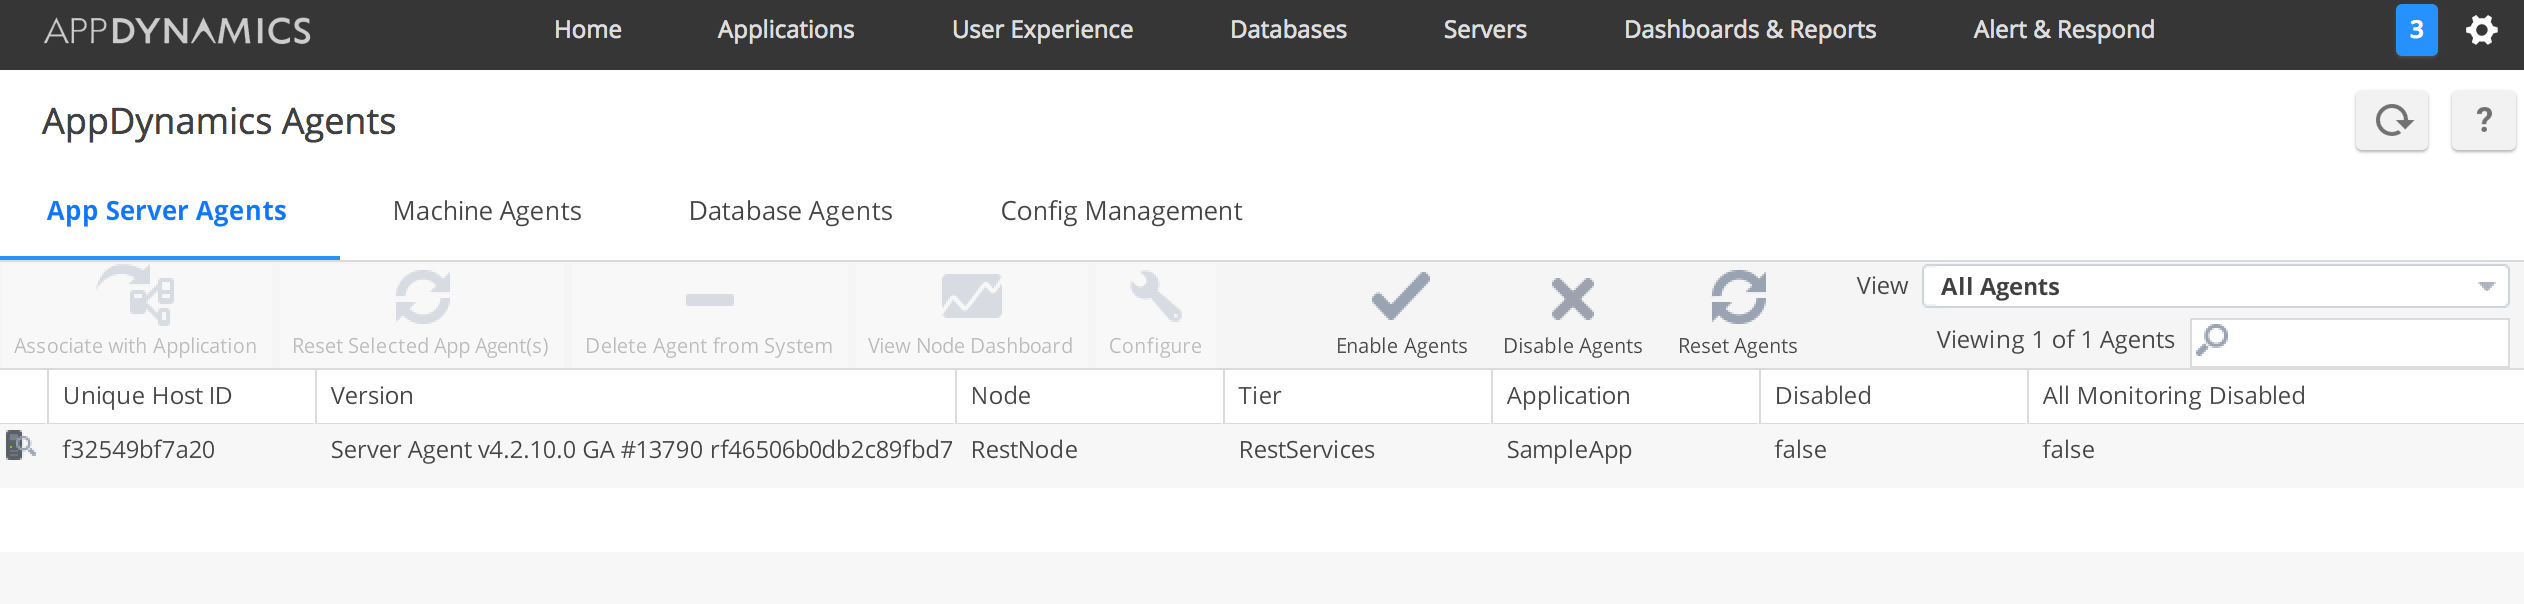
Note: If you don’t see the agent in the above screen, you may have to update your docker-compose.yml file. Most probably the controller environment entries are screwed up. You can tail the agent log using the following command:
docker exec -it rest tail-java-agent
Once you update docker-compose.yml, re run the docker-image command. Docker rebuilds the containers. BTW, don’t worry, it won’t take lot of time this time. Docker is smart enough to process ONLY the changes.
Keymetrics /ks/SampleApp$docker-compose up -d
db is up-to-date
Recreating rest
Recreating web
You will have to re run the docker exec command to install the agent and start the applications though.
docker exec -it rest install-appdynamics;docker exec rest start-all
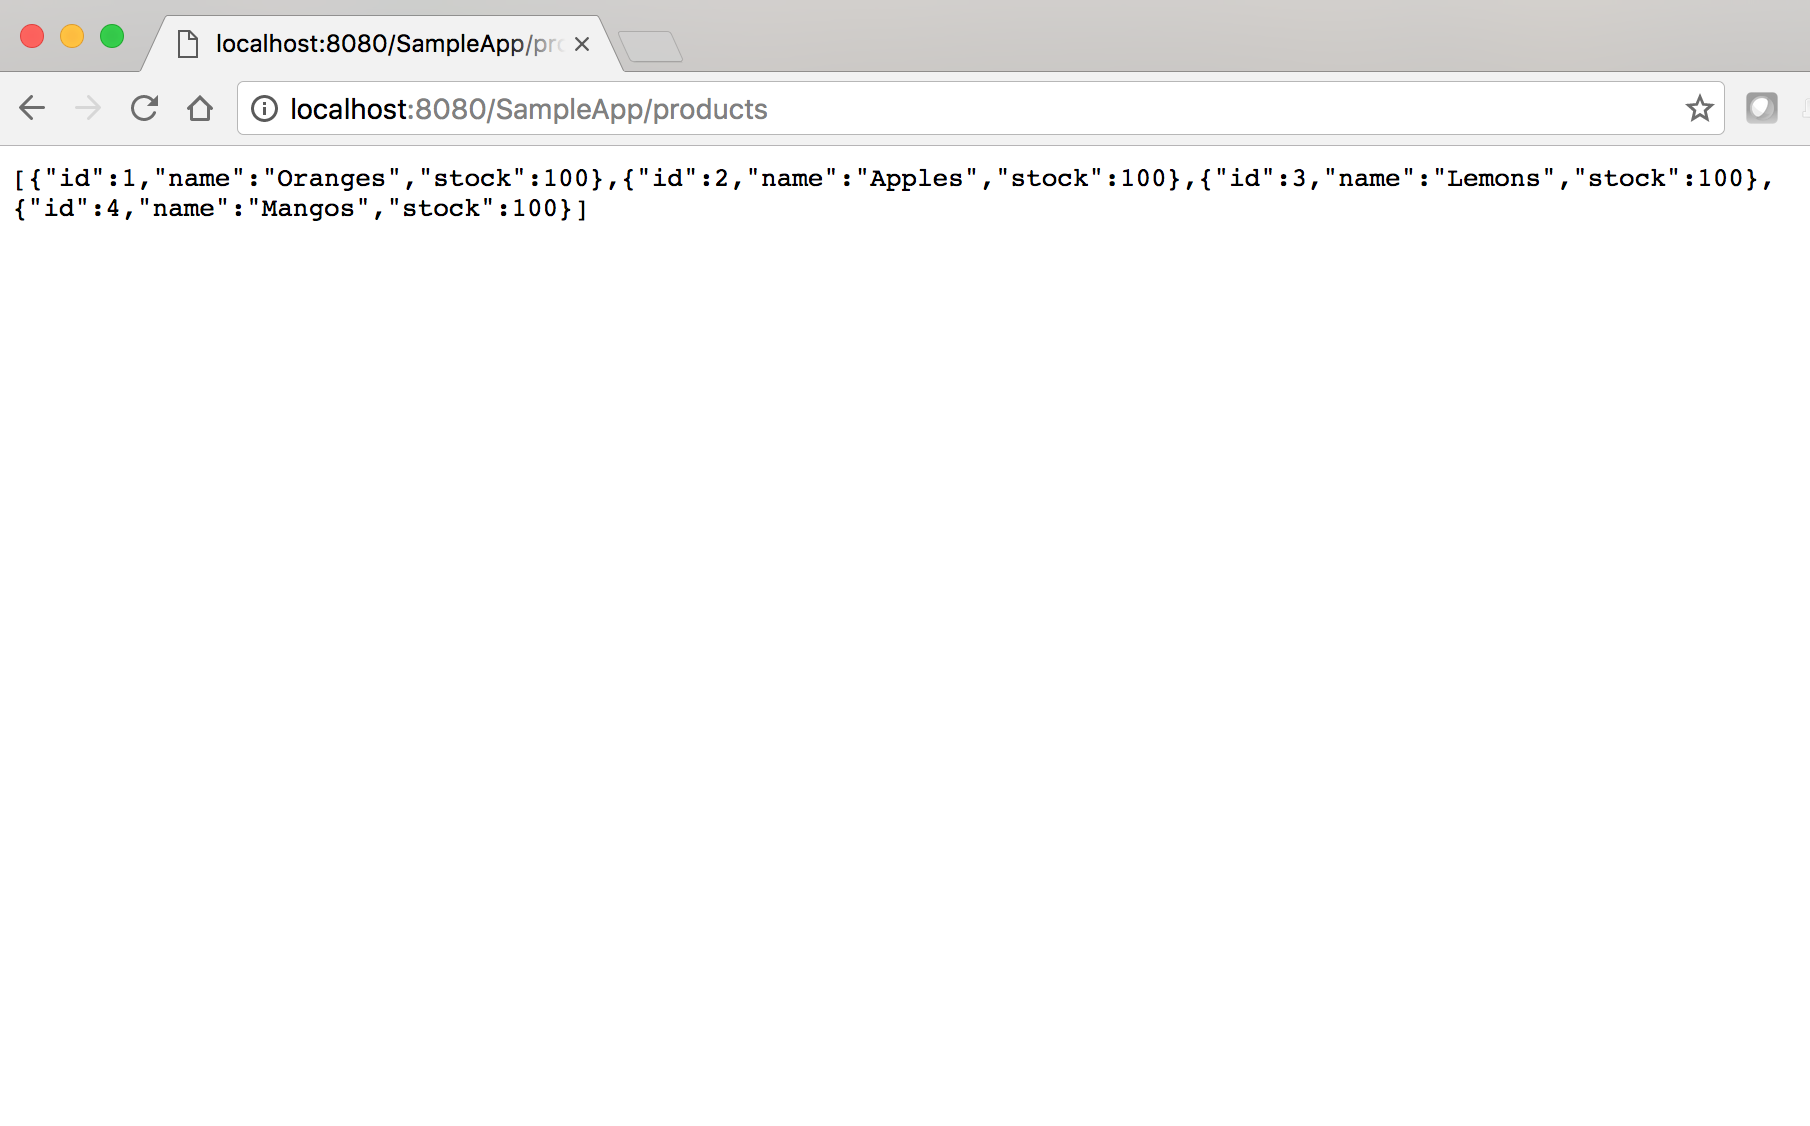
5. Logon to the Rest server using the url http://localhost:8080/SampleApp/products.
You will see the product list
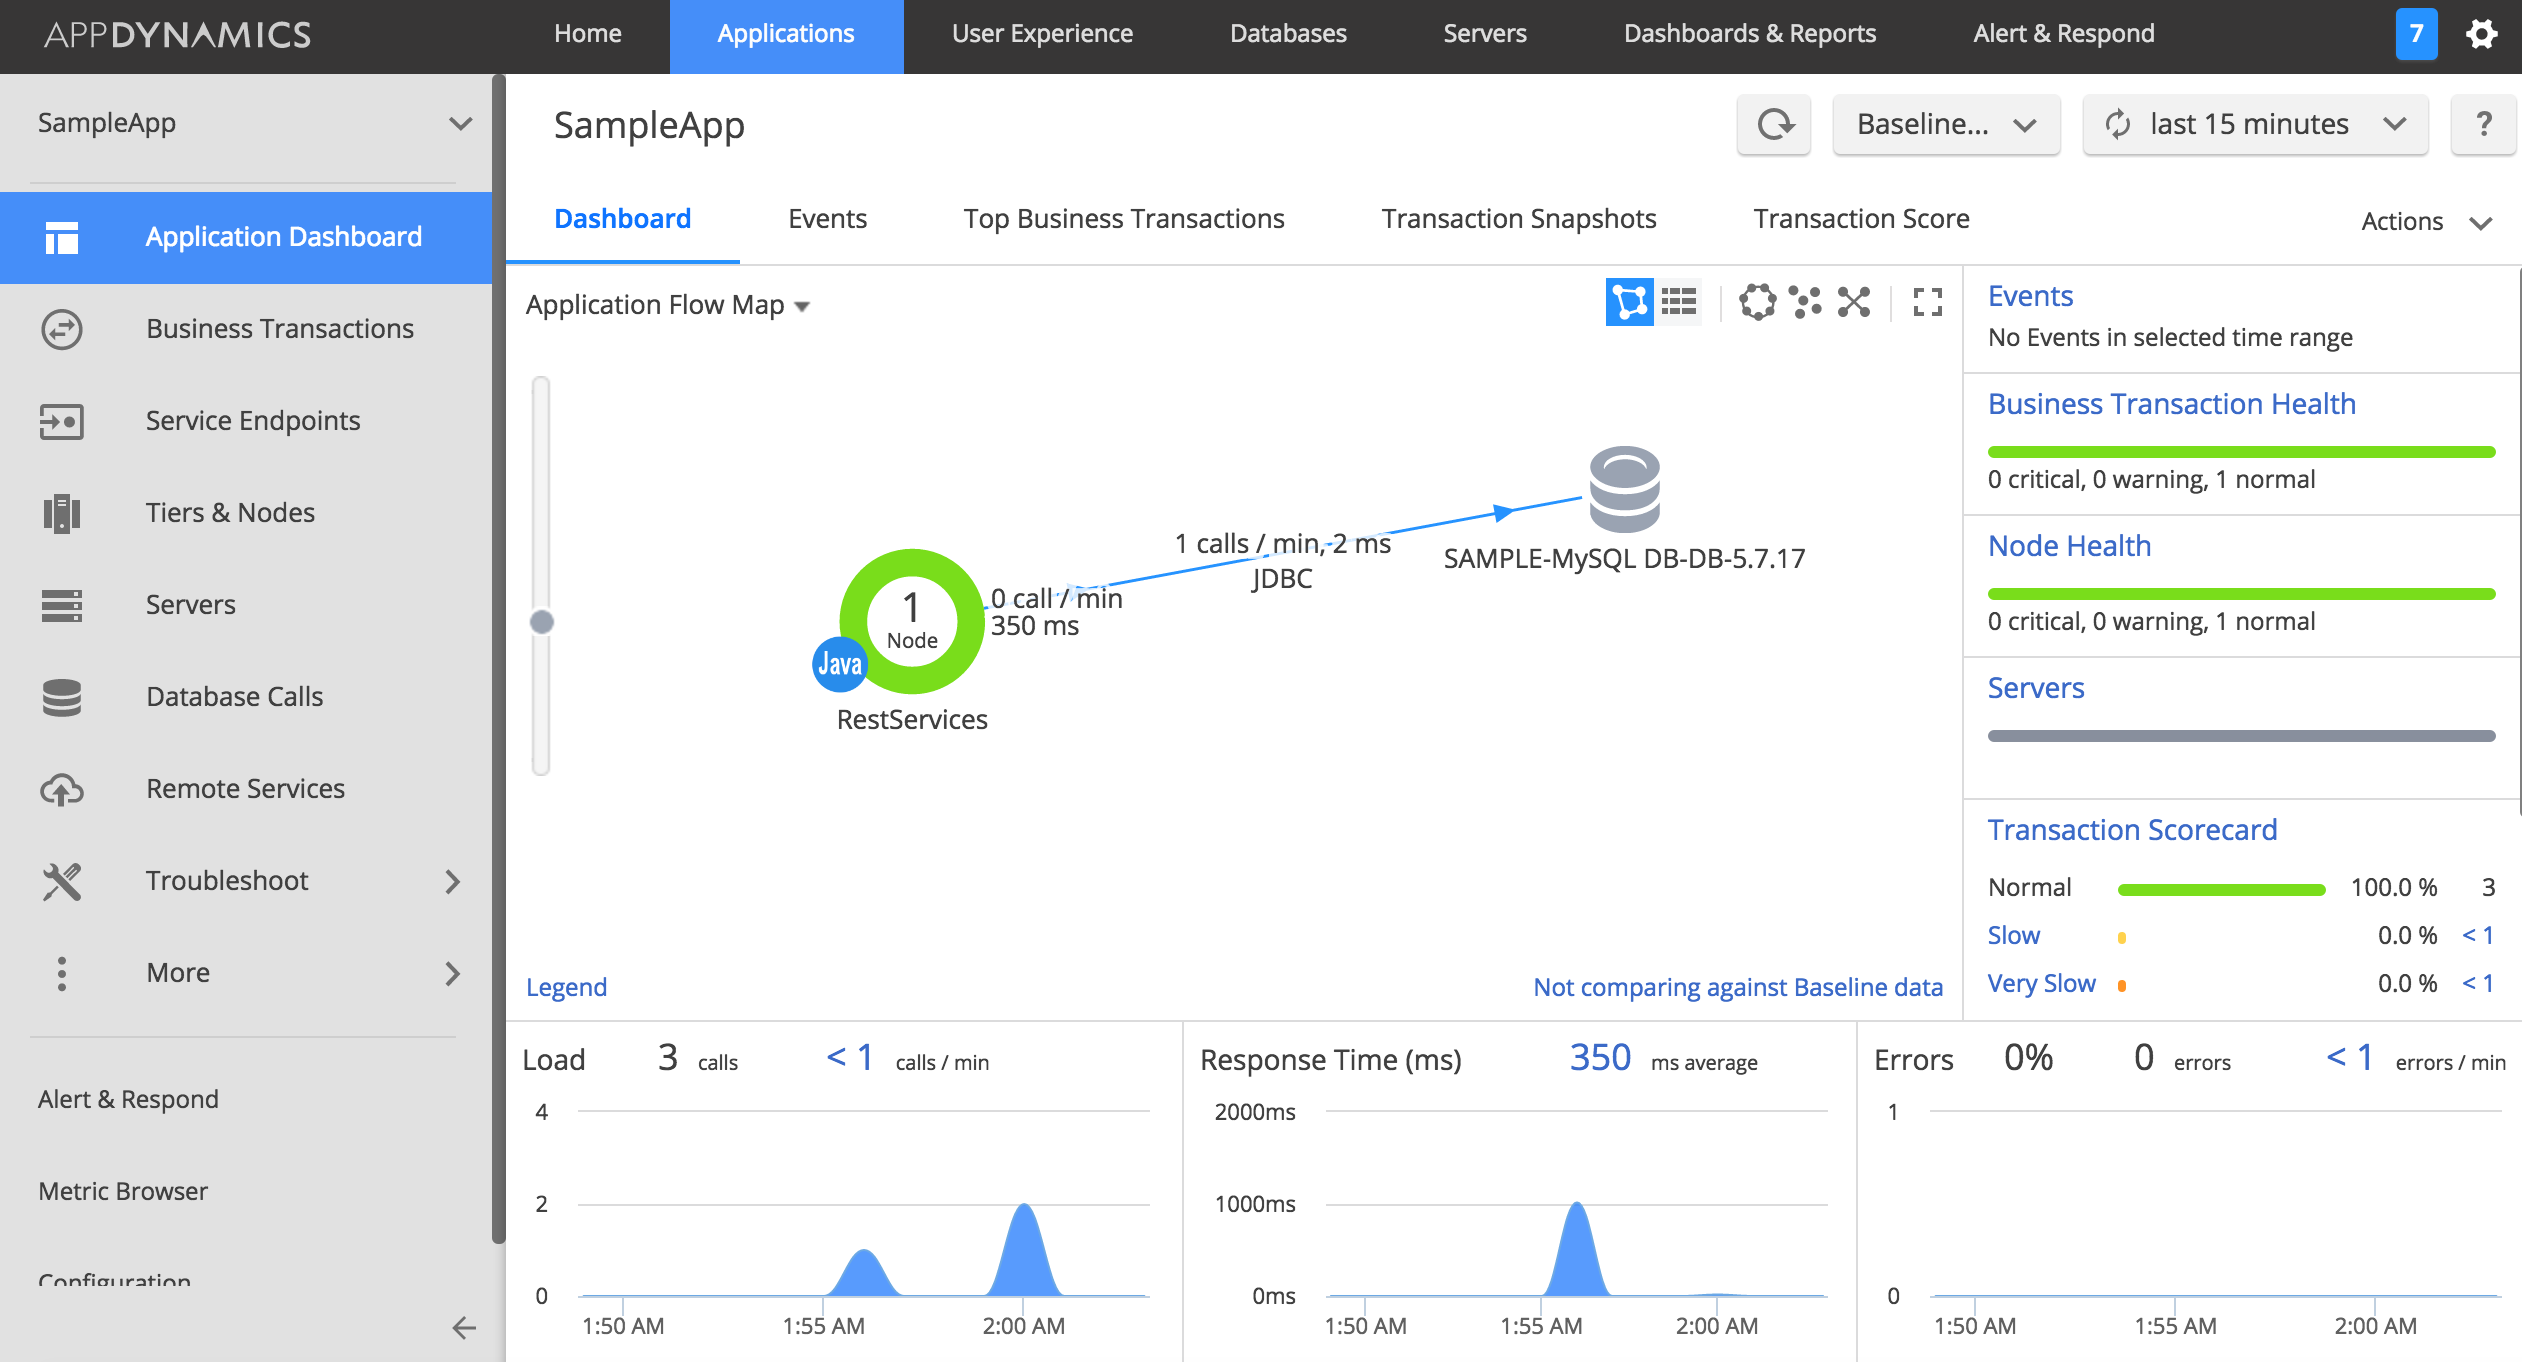
 6. Refresh the browser couple of times to create some transactions. Go to the Controller UI. You should see the SampleApp showing up in the Home page (or Applications page). Click on SampleApp and you should see the flow map as shown below
** Awesomeness **.
Now that you have the sample application feeding to the Controller UP, we can begin to explore various monitoring capabilities that AppDynamics provides. Can’t wait to see part 2 of this blog post ? Neither do I 🙂 Let’s roll.
Note: What if the metrics don’t show up in the Controller UI ? This is the most common issue you will encounter in any APM environment – The instrumented application not talking to the controller. What now ?
Well, the first place to look at is the agent log file. 9 out of 10 times, there is a connectivity issue preventing the agent from connecting to the controller. The agent log file is present in the logs directory under appdynmaics agent home directory. Let’s look at this in our docker application.
Keymetrics:~$docker exec -it rest bash
[root@14f2df630592 /]# tail -f /tomcat/appagent/ver4.2.10.0/logs/RestNode/agent.2017_01_03__11_50_17.0.log
If you see connectivity issues (such as Connection Refused, Connection Timeout etc), verify that you can connect to the Controller by pining and telnetting to the Controller IP/Hostname.
Happy Monitoring !!