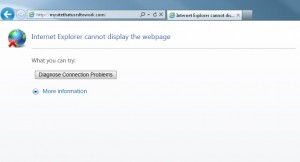
When the user cannot access your web application and instead sees a generic (and ugly) ‘Page cannot be displayed’, the root cause could range from simple typo in the URL to having exhausted the Thread Pool in the Application Web Container. The key to resolving this type of problem is asking the right questions well in the beginning of troubleshooting.
Pull up your sleeves, here are the top 8 reasons for this problem.
1. The Obvious: The URL has a typo.
Ask the user to double-check the URL. This may seem obvious but it is very critical that the user puts in the correct URL. It is better to ask the user to send you the URL so that you can examine and try it yourself. There are three things to note in the URL.
a. Is the protocol correct? (i.e) http vs https. Your Web Server admin could have very well blocked port 80 altogether (instead of a perhaps redirect to port 443 which will force https)
b. Is the domain name and the resource being accessed correctly spelled?
c. Is the Port number correct ? (if any). The browser will default http to 80 and https to 443.
2. The user’s PC does not have Network connection.
Ask the user to access other sites to make sure his PC is in the Network. If he cannot access any sites, chances are his PC is having some issues.
3. The user’s PC is not able to resolve names (DNS)
It is possible that the user’s PC is unable to resolve any names due to DNS issues. Have the user execute “nslookup <domain name>” in command prompt and ensure that he is able to resolve the domain name to an IP.
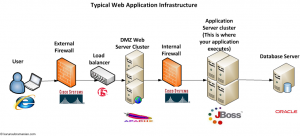
Now it gets interesting. A typical Web Application in an Enterprise involves several subsystems. Take look at the following diagram for a moment and then proceed. ( Not all environments will mimic this. Some are simpler and some are more complex)
4. The Web Server is not receiving users’s request
It is possible that user’s request is not hitting the Web Server (Example: Apache Web Server), the first entry point after going through the network devices such as external firewall, virus scanner, any specialized data center security devices such as Imperva, F5 Load Balancer etc. In practice there is seldom issues with these network devices. However it is completely possible. One way to check if the request is hitting the Web Server or not is to check the ‘access’ log of the Web Server.
Bummer: What happens if happen to have dozens of Web Servers? How long will it take for you to login to each server and check the access log? How can you easily check the activity your web servers at a glance? Answer at the end of this article.
5. The Web Server is down or unresponsive
Yes, now, that will be a problem. If the Web Server is down or unresponsive, users can’t get past the Web Server to your application. Check to see if the Web Server is up and running by reviewing the ‘access’ and ‘error’ logs and also by checking from Operating System’s perspective.
Example:
Unix:
ps -ef|grep http
Windows:
Use the Task manager.
Bummer: What happens if happen to have dozens of Web Servers ? Answer at the end of this article.
6. The Application Server is not receiving user’s request
The Web Serevers typically have some sort of plugin/proxy/ISAPI filter that redirect traffic from Web Servers to Application Servers. It is possible something is wrong with the plugin/proxy/isapi filter. Check the Application Server logs and the Web Server proxy/pluing logs to make sure this redirection happens correctly. (Note sometimes you will actually get a HTTP ‘404’ error for this type of plugin/proxy issue)
Bummer: What happens if happen to have dozens of Application Servers ? Answer at the end of this article.
7. The Application Server is down or not responsive
My favorite territory. If the Application Server is down or not responsive, obviously you can’t access the application. Log on to each Application Server and ensure it is healthy by reviewing the Standard Out of the JVM, Standard Error of the JVM and any Application specific log files. Also check if the process is up and running by using ‘ps’ on unix and ‘Task Manager’ on Windows.
A completely ‘down’ Application Server is somewhat easier to diagnose rather than an ‘unresponsive Application’ i.e hung application. If the application process is up but the application is not responsive, in JEE world, there could be several reasons.
a. The JVM has run out of memory and constantly throwing ‘OutOfMemory’ error
b. Heap is full and Garbage Collection is taking for ever to reclaim space. In most cases, JVM is paused during Garbage collection.
c. The Application Server has run out of Web Container threads to process new requests. This could be because of a slow or unresponsive backend such as Database or because of an exhausted backend connection pool.
Bummer: What happens if happen to have dozens of Application Servers Answer at the end of this article.
8. A network level ‘connection reset’ is happening somewhere
This is perhaps the most difficult to solve. It is quite possible that somewhere along the line, F5, Web Server or Application server is issuing a tcp ‘connection reset’ for whatever reason. The reasons could range from ‘Large Kerberos packet size’ in a Windows Single Sign On environment to some ‘SSL handshake issue’. You need to get your hands dirty with ‘Wireshark’ or ‘Microsoft Network Monitor’ to dig into find out what’s happening.
Note: I’m not dealing with HTTP ‘404’ error which simply means the requested resource is not found (such as missing jpg file or something like that) The error I’m dealing with in this article is the good old ‘Internet Explorer cannot display the webpage’ where in the connection to the website was not made at all.
There you have it. 8 reasons for the ‘page cannot be displayed’. Hopefully your issue is due to reason 1 and not the other extreme.
Good luck.
Oh, wait. Did I forget something?
I know what you are asking – How do I monitor my servers when I have dozens of them (Web Servers, Application Servers etc). Glad you asked.
The solution is to invest in a good quality commercial APM tool. There are tons of them out there and lot of them are excellent. An APM solution will give you the following benefits.
1. Monitor end to end performance
2. Consolidate metrics from several systems (such as dozens of web servers) in to a unified easy to use interface (dashboards) so that you can uncover issues at a glance.
3. Trigger alerts based on the threshold set by you (or automatically learned thresholds)
4. Take ‘actions’ automatically when certain event occurs
5. Reveal the complete transaction trace to show the response time by the ‘method level’
6. Using transaction snapshots, reveal the exact line of code that is causing issues
7. Track Java heap to uncover leak suspects
and much more.
Implement an APM. Sit back and Relax (until the Alert goes off, of course).
Good luck.


Informative and real good explanation
Thanks for the detailed list , Sir ! This is the most frequent issue I encounter and its been very helpful !