Let’s face it. Nobody likes a slow application. It is our job to make sure our applications fulfill the functionality need completely, but at the same time delivers good user experience.
In 16 years of my experience in technical support primarily in the world of JEE, while I cannot honestly say ‘I have seen it all’, I can say “I have seen a lot“. Here are the top 10 reasons why your Java application may slow.
Note that this list is NOT ordered in anyway, meaning reason 1 is not always the most popular reason for the slowness. These are all equally critical issues that can cause your application to crawl.
1. There is a sudden spike in the ‘Load’ that you did not notice
This is especially true when your application processes requests from external entities (for example, a financial institution processing batch updates from a data provider). Since you cannot really control (for the most part) what others might send, you can suffer a surge in incoming requests and hence your application can slow down.
How can you monitor?
You must monitor the ‘throughput’ of the application (specifically, number of requests/minute). You will most probably need a commercial APM (Application Performance Management) tool to monitor this reliably. If you don’t have an APM solution implemented (why ?), try to come up with some home grown script/program that can monitor this. For one or my clients, I had to write a program that performed a ‘row count’ of a Database table that stored the ‘processed orders’. I had to run this program through a scheduler (cron) periodically and send an alert email if the number of processed records crossed a threshold.
2. There is a poorly responding backend system
Your application may talk to one or more backend systems other than a Database. Perhaps it talks to an external system using a Web Service call. Perhaps it sends a WebSphere MQ message to a remote Queue Manager (that in turn routes the message to an external system to get a response). If any of these external systems respond poorly (or even stop completely), your application will suffer.
How can you monitor?
You must monitor the response time of the external systems experienced by your application. A periodic synthetic transaction might help (if feasible). If you log the response times in a log file, you could monitor the particular entry in the log file. But the best bet would be to use an APM solution and instrument the specific method that makes the external call. Tools such as AppDynamics and CA Wily Introscope (among many others) can automatically detect the backends and reveal the response times.
3. Your database calls are taking for ever
This is a big one. It is possible that the sql queries (or Stored procedures) that originate from your application run extremely slow at the Database Server. This could be due to the following reasons:
a. Database Server is running our System resources such as CPU, Memory etc,
b. A Block in the Database
c. Missing index in the database,
d. Your query really runs slow (perhaps you are missing a ‘where’ clause). In this case, work with a DBA to tune the query/SP.
How can you monitor ?
To some extent, monitoring from the DB side should help i.e the DBAs should have monitoring for things like long running queries, blocks, deadlocks etc. From application’s perspective, you must monitor the JDBC response times experienced by your application. You can either log this information in log file (expensive and not recommended) or use an APM tool. New generation APM tools like Dynatrace (among many others) can reveal slow running JDBC calls including the actual SQL query or stored procedure.
4. You are running out Database connections
This is another big one. Typically 50 JDBC connections per JVM should be more than enough. But it greatly depends on the Application. They key is to make sure you are not maxing out of DB connections. When you max out the DB Connection Pool, your requests are going to wait for an available connection which results in painful slow response time. The reason why you are maxing out of the DB connections should be found out. It could be that you are NOT closing the DB connections properly.
How can you monitor?
If your application server has JMX console, Connection pools can be monitored via the MBeans, but it can be a painful process. You can also write your own Java program (JMX client) to connect and retrieve values from the Mbeans. Easy way is to install a commercial APM tool
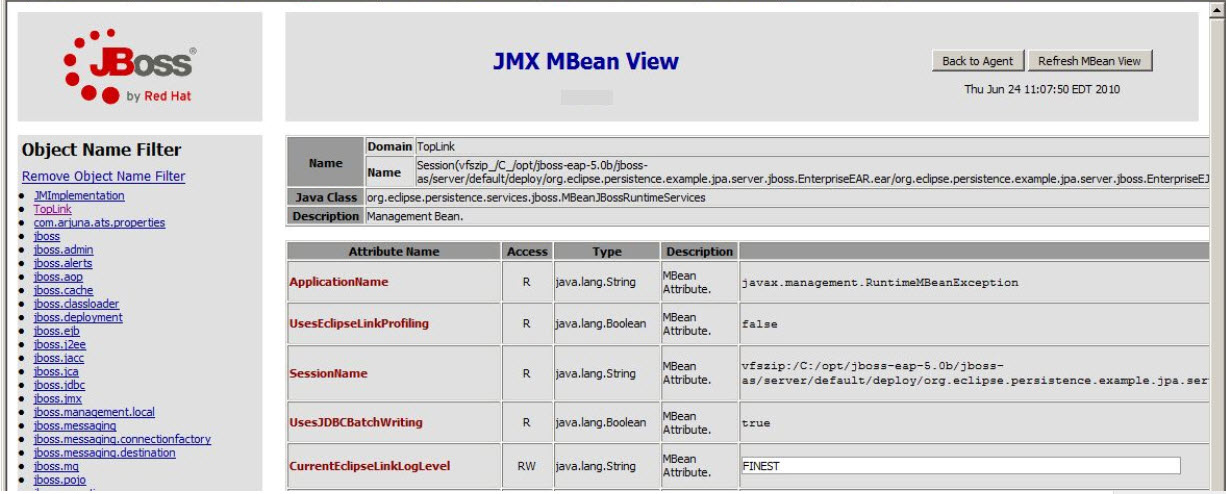
Image from wiki
5. You are running out of Threads
Work enters to your application via a Thread. You only have limited number of Threads to process incoming requests (limited by the Thread Pool). When you exhaust all the available threads in the Thread pool, subsequent requests go into ‘wait’ state, waiting for an available thread – painful wait time. The reason why you are running of out thread should be investigated. It could be because of a poorly performing backend or a slow DB response time.
How can you monitor?
If your application server has JMX console, Thread pools can be monitored via the MBeans, but it can be a painful process. You can also write your own Java program (JMX client) to connect and retrieve values from the Mbeans. Easy way is to install a commercial APM tool. Some Application Server consoles (such as IBM Websphere application server) have built in monitoring dashboards as part of the Admin console. But it can be extremely slow and not very flexible.
6. The Server hosting your application is running slow or running out of resources
Yes, even with Cloud and dynamically expandable hardware, the fact is hardware is not unlimited. When the CPU hits 100% in your host Server, your application is going to suffer. With shared hardware in most enterprises, it is possible that some other application is chewing up all the CPU and your application just becomes a victim.
How can you Monitor?
Operating system level monitoring tools will help. Tools like Nagios can help monitor the infrastructure effectively.
7. Super excessive logging in your Application
Logging is expensive, in terms of resource usage. While debug logging will help in certain situations, in production environments, keep the logging to a minimum level (perhaps ‘INFO’ or ‘WARN’ log4j levels). An additional side effect of excessive logging is Disk drives filling up (which can have its own consequences). One of my clients was logging every single sql statement generated by the application (Hibernate verbose logging) and the application was generating 500 MB log file every day. While the performance impact was not too bad in this case, it created disk space issue until I disabled the verbose logging.
How can you monitor ?
Periodically check your Application log files (JVM system out and system error). If you notice unnecessary noise, get rid of those logging entries. Checkout logstash.
8. Garbage collection overhead
This is a critical performance area for any Java application. If you are running of Java Heap, the JVM will initiate GC to keep up with the memory demand. GC tuning is a separate and exhaustive topic by itself. Short story is GC will consume resources and excessive GC overhead will slow down your application. Pay attention to the Minimum (-Xms) and Maximum (-Xmx) Heap size values in the Java command line options.
How can you monitor?
Enable verbose GC logging and watch the log file. You enable verbose GC logging with the options -verbose:gc -XX:+PrintGCDetails XX:+PrintGCTimeStamps.
Once the logs are collected, you can either eyeball it or use a tool like “IBM Pattern Modeling and Analysis Tool for Java Garbage Collector”
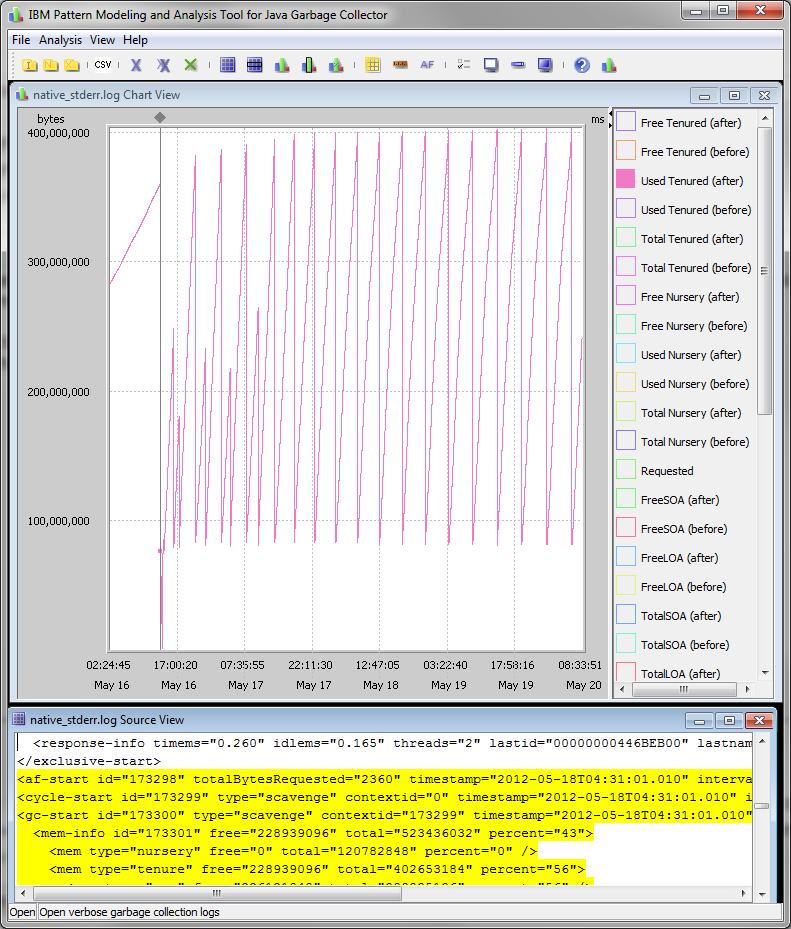
Image from ibm.com
9. Third party jar files that you have included in your application is buggy
It is not uncommon to use third party jar files to use certain functionality for your application. However care must be taken to ensure there are no performance implications. Even if the jar is reliable and proven (such as spring.jar), there may be issues when you upgrade the spring version without analyzing the release notes etc. Perhaps you may be using the API in a certain way that changed with the newer release of spring. I have seen third party jars causing severe memory leak. I have also seen a rules engine (that was integrated into my client’s JEE Application) that ran into ‘infinite loop’ issue causing the entire application to slow down.
How can you monitor?
This can be trick to monitor. There is no bullet proof way to monitor just one jar file/plugin unless your application specifically uses the thrid part jar for certain specific transactions, in which case you can use an APM tool to instrument montioring for just that particular method. Even then, you won’t know if it is your code or the third part jar that is creating the issue. Through analysis is required to troubleshoot such issue.
10. Poor Application Architecture
No matter how much tuning you put in your code, application server and database servers, if the Architecture is flawed, your application will be slow. For example,
a. Even when not required, using ‘persistent’ messages with JMS.
b. Storing more than necessary data in a HTTP ‘Session’ increasing its size
c. Not using (or using misconfigured) caching solution
Application architecture is a vast subject and scores of books have been written on this subject. Study carefully.
How can you monitor?
There is no specific monitoring to be done to monitor design flaws. Design issues will be revealed when you thoroughly analyze the problem and the available monitoring data.
There you have it. Application performance tuning starts from the design stage. There are various reasons your application could be slow. You must be diligent to monitor as much relevant metrics you can about your application and act promptly to avoid customer impact. Investing in a good quality APM solution adds heaps (no pun intended) of ammunition to your weapons in the battle of performance monitoring.
Good luck.
Really a great article to know more about performance increase and shows ways to get rid of some issues.
Thank you so much for your time and for this great article.. 🙂
This is one of the best article I came across . Currently i’m facing a similar situation where in the application performance goes slow gradually and once we restart – it seems to be fine for 2 days or so.
As far the above checklist is concerned – CPU has never touch 100%, Heap health is always less than 50%, load is always the same during normal and slow situation , we do have backend system using web services -again its average response times seems to be the same during normal and slowness, from AppDynamics – i see that % of time spent in webservices calls, db calls is less than the internal method calls.What is that we can do here?
Thanks.
Can you check the garbage collection pause times ? Since you have appdynamics, you should be able to see it. The fact that a restart fixes the issue tells me that there may be heap issue, or there is some saturation happening in one of the subsystems. You can take a thread dump before restarting and see where the application is stuck.
I am going through similar kind of issue. I have a server that consists of Payment and Order related modules and have another server consisting of Schedulers handling cron jobs. Problem is that when as soon as schedulers are deployed in server 2, APIs of server 1 starts giving response time of around 7sec which is around 2sec when schedulers are not deployed. FYI : Server 1 and Server 2 both uses same DB to access data.
Beautiful Article I have ever read. In my application load test everything goes fine till half an hour, then after 30mins of test I can see the CPU increases, Resp Time increases, Throughput and hits/sec decreases, GC looks fine, threads are also not fully used. Then what will be the case?
Hi Isha.
I wonder if there is an increase in disk i/o that’s driving the CPU utilization up. Are you perhaps able to take 2 or 3 thread dumps and see what the JVM is doing ?
It’s really very good article and very useful to troubleshoot the application slow issues
Hi Karun, This is a very informative article. It helped me to understand many things about Java based applications which I didn’t know. In my company we have inhouse application based on Java.
It is Java(TM) Platform SE binary application. We have users from many countries such as India, Kuwait, KSA, UAE, Bahrain, Qatar, Jordan, etc. I am using it from India and I don’t get any issue with it. But specifically users from UAE are having slowness and hanging issue of this application. But no other market is facing this issue. Can you please help me understand what might be the reasons behind it.
Hi, Chaitanya.
It’s good that you have narrowed down your issue to just UAE. Most likely cause would be either the network bandwidth/connection, or the PC/MAC settings. Perform some tests to compare network speed, and also compare the windows/mac settings with other countries that do not have the issue.
Good luck.
Very helpful content, Thank you for the effort.