≡ Menu

Ten things you need to know about Java memory leak

Java memory leaks can be deadly, and difficult to troubleshoot. Are you one of those shops where you restart your Application Servers at regular intervals (weekly, daily or more frequently)? It is pathetic, is it not? Wait a minute, gone are the days where we had 128 MB memory on servers. We have several giga bytes of memory on servers, don’t we? Why do we still run into memory issues? Good question. But sad truth is there are several reasons why Memory leak is not something that will go away. All you can do is to prepare yourself. And that’s what this article is about. Let’s dive into 10 things you need to know about Java memory leak.

1.  Java Heap Memory leak is different from Native Memory leak

Java heap is where the objects created by your application live. The maximum heap is determined by the –Xmx flag of the Java command line that starts the application. If you write code that leaks memory, there is where it will blow up.

Read More

How to create custom monitoring dashboards in AppDynamics?

Custom Dashboard is one of the most powerful features of AppDynamics. It lets you group monitoring metrics that are relevant (and make sense to the user) in one central dashboard. Custom Dashboards are ‘read only’ elements. So, you don’t have to worry about users updating any Appdynamics configuration. You can build sophisticated dashboards with drill down capabilities.

To create a new custom dashboard, click on the icon at the top and choose ‘Custom Dashboards’ as shown below

In the resulting screen, click on ‘Create Dashboard’

Read More

How to instrument a Java application with AppDynamics?

Agent is a vital part of Appdynamics framework. It is the agent that acts like a workhorse to pull metrics from the Application and push it to the Controller. Agent is a piece of software that is installed ON your application. The only function of the agent is to pull the monitoring metrics and send them to the AppDynamics Controller where the data is crunched and made available via the Controller UI. Note that there is NO need of a code change in your application. There is however a setup/configuration change required depending on the platform. In this article, I will explain how to instrument a Java Application.

Read More

How to find out which jar files are loaded by your Application?

At times you may want to find out which jar files are loaded by your Application. It is especially useful if you are dealing with classes present in multiple jar files and causing ClassCast exceptions. It is also useful if you are receiving ClassNotFound error and want to ensure the jar file that has the class file is loaded by your application.

There are few ways to do this.

Read More

A log file is the single most important piece of resource you need in order to tackle almost any problem with your application. I still remember having to troubleshoot complex application performance issues when APM tools were not yet born. All I had were access.log and error.log from a Web Server, standard out and standard error file from the application, and the syslog from the host OS. And guess what? They were more than enough to see what was going on.

But gone are the good old days. The complexity software and hardware infrastructure on which applications are presently deployed is beyond imagination. Application infrastructure is increasingly becoming sort of ‘black box’, and having the right tools to gain insight to this black box is mission critical.

Two parallel set of management software have emerged:

Read More

Configuring Alerts in AppDynamics

What good is an APM solution without a solid Alerting system that is easy to configure? Appdynamics alerting system is very robust with lots of options to customize.

First of all, AppDynamics comes with several pre built alerts with thresholds that are dynamically learned. This means without configuring anything, you get out-of-the-box alerting. This default alerting is visible in the Dashboard via the coloring scheme (for example, a node icon turning RED). However, the default alerting is not enough for most cases. You would want to customize the default ones, and perhaps add your own.

Two major components of Appdynamics Alerting system

Read More

How to setup curator to archive old Elastic Search indices

If you don’t have a proper archival process, data in your elastic search cluster will grow uncontrollably. You risk losing valuable log data if you don’t make sure you have enough space in your disk subsystem. From the elastic search log file, you might see messages like below:

[INFO ][cluster.routing.allocation.decider] [myELK-Node2] low disk watermark [85%] exceeded on [aULsc9C7R1ecGfHvy0gNqg][ myELK -Node1] free: 2gb[10%], replicas will not be assigned to this node

[WARN ][cluster.routing.allocation.decider] [myELK -Node2] high disk watermark [90%] exceeded on [G19eWLL9Skqcq8Mb0p-xTg][ myELK -Node2] free: 1.9gb[9.8%], shards will be relocated away from this node

INFO ][cluster.routing.allocation.decider] [myELK -Node2] high disk watermark exceeded on one or more nodes, rerouting shards

That is not pretty.

There are few ways to delete unused/old indexes.

Read More

Finding your way in AppDynamics Controller UI

Appdynamics controller UI is very versatile, responsive and easy to use. But at times, it might look like you are beating around the bush but not getting to what you really want. For example, you can easily get lost in the amount of transaction snapshots available to you. (All you have to do is use the ‘search’ box at the top right to filter out the Transaction snapshots). In this tutorial, I’ll show you the most frequently used parts of the Controller UI.

The opening Screen

The Flow map (the mighty Dashboard that you don’t have to build)

Read More

What is SYN_SENT socket status?

Say you are troubleshooting a connectivity issue between two devices. For instance, let’s say you believe your Web Server is not able to connect to your Application Server, because you are seeing Connection timed out or Connection Refused error all over your log files. One of the easiest (yet critical) ways to check the connectivity is using netstat command. You might use netstat command something like the following:

netstat -an

or

netstat -an | grep 

The output shows all the sockets that in the system. Each socket has various status. For example, a socket can be in ESTABLISHED status or in LISTENING status. These are the good statuses.

However, if you are having a bad day, you might see this weird SYN_SENT status.

➜ ~ netstat -an | grep 23.96.52.51
tcp4 0 0 192.168.0.4.49876 23.96.52.53.22 SYN_SENT

The goal of this post is to demystify what SYN_SENT is and how you can go about fixing it.

But first let’s take a quick look at how TCP/IP works when a network connection is formed.

TCP/IP 101


TCP/IP (Transmission Control Protocol/Internet Protocol) is a set of protocols used to transmit and receive data. US Department of Defence invented it, and it’s been the language of the Networks since early 80s (right, some of you had not been born yet). Internet buzzes on top of TCP/IP. While the protocol was designed to work on any physical medium, practically all the networks you will deal with nowadays are Ethernet and/or WiFi.

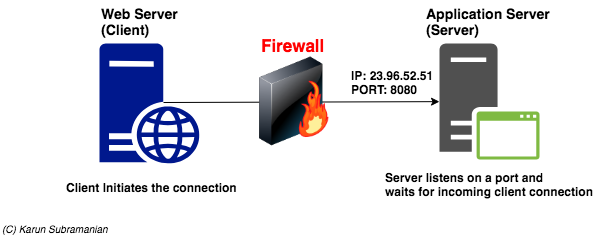
In a distributed applications/services setup (which most of us ar dealing with), the Network architecture involved is the Client-Server architecture. Let’s first look at how this looks.

client_server

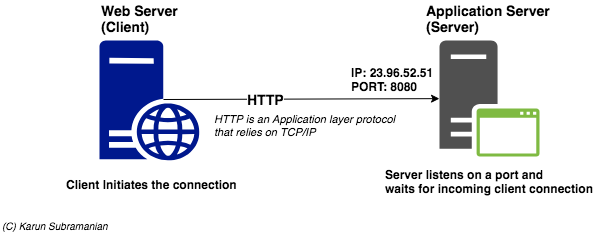
In the above diagram, Web Server is the client and Application Server is the Server. In a Client-Server architecture, the Server listens on a particular port. Ports are used to identify a particular application/program. For instance, here are some of the well-known Server applications and their port numbers.

Screen Shot 2018-08-12 at 10.06.58 PM

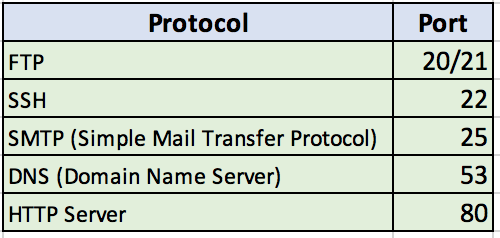
In our example, our application server listens on port 8080 (and incidentally is also a web server. We don’t need to dwell deep in to this fact, but as you may know, many application servers have a small footprint web server embedded in them).


Another quick note about how HTTP relates to TCP:

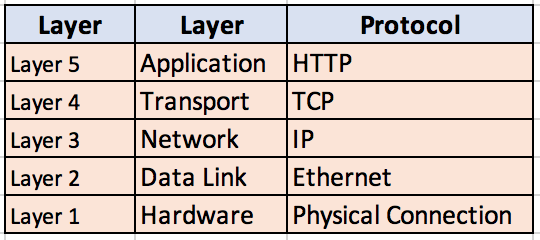
TCP/IP uses a 5 layer reference model (This is little different from the original 7 layer OSI model).

HTTP is an application layer protocol. And it relies on underlying TCP protocol in the transport layer. To lay this out approximately:

Screen Shot 2018-08-12 at 9.32.43 PM

Digging deep into a TCP Connection


TCP is a connection-oriented transport service (unlike UDP – User Datagram Protocol, which is a connection-less transport service). What do I mean by connection-oriented transport service? I mean the following:

  1. It ensures guaranteed data delivery to the destination
  2. It has built-in error checks. And in case of errors, the protocol provides for re-transmission of data
  3. The order of the data packets are guaranteed to be accurate.

When the client initiates a connection to Server, there is a three-way handshake happening. here’s what’s going on.

tcp-hand-shake

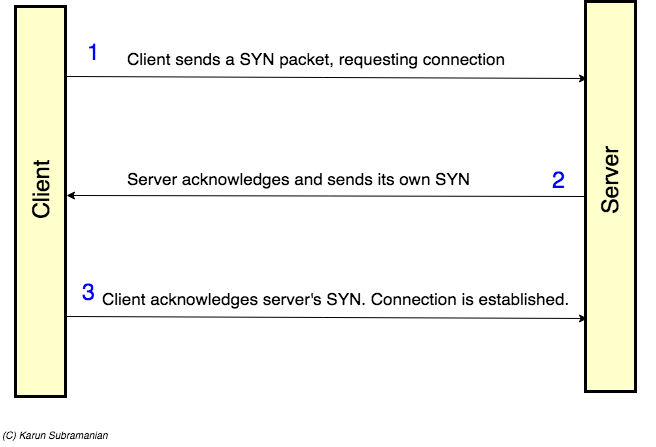
  1. First client sends a TCP segment with SYN control bit (synchronize) set.
  2. If server receives client’s data (Yay!!), it sends acknowledgement along with its own SYN request
  3. Client sends acknowledgement. Connection is established.


Checking the status of a TCP connection


A TCP connection progresses through several statuses.

LISTEN

SYN-SENT

SYN-RECEIVED

ESTABLISHED

FIN-WAIT-1

FIN-WAIT-2

CLOSE-WAIT

CLOSING

LAST-ACK

TIME-WAIT

CLOSED

You can reveal a connection status by using netstat.

netstat -an

You would typically be grepping the output of netstat for your remote IP address.

➜ ~ netstat -an | grep 23.96.52.51 

tcp4 0 0 192.168.0.4.49876 23.96.52.53.22 SYN_SENT

Now, based on the knowledge you’ve gained so far, you can readily tell that this connection is waiting for the server to respond. This most probably means the client’s request never got to the Server. And 99% of the time, this indicates some sort of Network block due to a firewall.

fw

Note that the SYN_SENT status will not remain for long time. It only lasts for couple of seconds. So, you have to be quick in running the netstat command (perhaps in another terminal window)

There you have it. Next time when you see SYN_SENT, you know who to reach out to. Your Network team. 🙂

Good luck.

ELK (Elasticsearch) up and running in few minutes

There is an excellent how-to blog post written by Philippe Creux on how to deploy ELK stack. He goes to explain in detail his logstash configuration files and other technical stuff.

For anyone looking to get a quick start on ELK, I would recommend browsing through this article.

ELK has been creating lot of buzz and for good reasons. It is fast, reliable, highly scalable and above all, easy to setup. It is totally cloud friendly. Almost every setting in Elastic search is preconfigured and ready to use for production deployment (note: almost).

Though not necessary, it is recommended to introduce a queuing mechanism before logstash crunches the data and sends to Elasticsearch. This queue provides a buffer so that Logstash does not get overloaded with surge in data. In this way, you have time to react for scaling your environment without choking. Rabbitmq is a popular choice for ELK stack.

Here is the full article. Thanks much for folks at brewhouse for sharing this.

http://brewhouse.io/blog/2014/11/04/big-data-with-elk-stack.html


Happy Monitoring!