Java memory leaks can be deadly, and difficult to troubleshoot. Are you one of those shops where you restart your Application Servers at regular intervals (weekly, daily or more frequently)? It is pathetic, is it not? Wait a minute, gone are the days where we had 128 MB memory on servers. We have several giga bytes of memory on servers, don’t we? Why do we still run into memory issues? Good question. But sad truth is there are several reasons why Memory leak is not something that will go away. All you can do is to prepare yourself. And that’s what this article is about. Let’s dive into 10 things you need to know about Java memory leak.
1. Java Heap Memory leak is different from Native Memory leak
Java heap is where the objects created by your application live. The maximum heap is determined by the –Xmx flag of the Java command line that starts the application. If you write code that leaks memory, there is where it will blow up.
Native memory is ‘outside’ Java heap but still within the total ‘process size’. This is where low level driver (such as file system handles, threads etc) consumes memory. If you use a third party library that uses native memory and has leaks, this is where it will blow up.
In this article, whenever I talk about Memory leak, I refer to Java heap (and NOT native memory)
Total process size = Java Heap + Native Memory
2. Memory leak will be obvious
Memory leak will be very obvious. But you will need some sort of monitoring tool. Take a look at a classic memory leak below
% Heap Utilization over a week
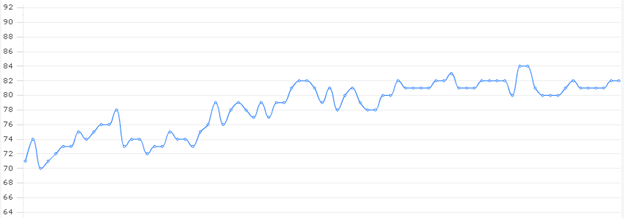
You see how the heap utilization keeps going on but never really comes down over time? A healthy application will have a saw tooth pattern on heap usage graph (the usage will go up over time but GC will bring it back down, and this cycle will repeat).
While Memory leak will be obvious, unfortunately, the root cause of Memory leak will NOT be obvious. See below.
3. You can take a heap dump to see what is filling up the heap
If you want to know what is filling up the heap, you could take a heap dump and analyze. It is not a straight forward process and it can be time consuming. But it is a very good way to get insight into your application. You application server may provide commands/scripts to take heap dump. But the following command will work for any Java process
jmap –dump:format=b,file=<dump file path> <pid>
Note that taking heap dump will pause the JVM. If your heap is large (4gb +), it might take several seconds to dump the heap. So, before running this in production, make sure you can take this hit.
My favorite tool for analyzing Heap dump is Eclipse Memory Analyzer. It is fast and very versatile. I have a separate article on how to use Eclipse Memory Analyzer.
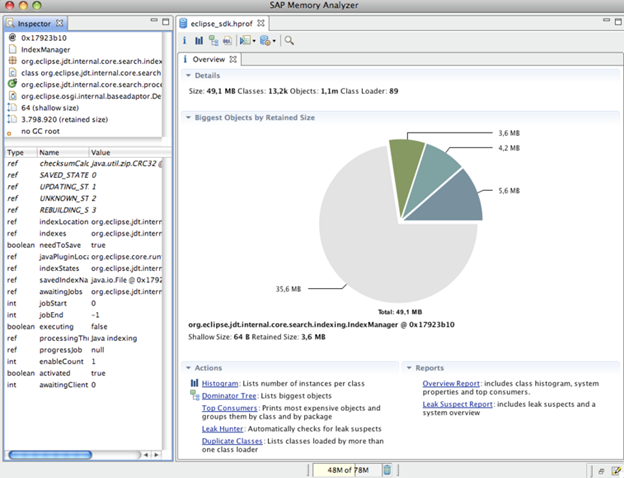
Image Source: www.eclipse.org
4. Common reason 1 for Java memory leak
Not cleaning up after ‘Exceptions’. What do I mean by this? Say at run time you encounter an unexpected exception (perhaps a remote service times out). When the function breaks due to exception, you must ensure that you clean up whatever you were doing. For example, if you had a DB transaction going on, you have to close all that in the ‘finally’ block of your ‘try-catch’. This is especially important if the exception is recurring. Many administrators and developers don’t care about repeating ‘harmless’ exceptions. There is nothing harmless about an ‘exception’. Make sure you handle them correctly.
5. Common reason 2 for Java memory leak
Handling large result set in memory. You don’t want to bring millions of records in one call. This seems obvious but I still see developers underestimate the size of the result set in production and end up filling up JVM heap. Use techniques like ‘pagination’ or ‘lazy loading’
6. OutOfMemoryError does NOT necessarily mean Memory Leak
Don’t straight away equate ‘OutOfMemoryError’ to Memory leak. In fact you can have memory leak with no errors at all (performance will tank due to excessive GC though). There are several reasons why ‘OutOfMemory’ can occur. For example, it can occur due to ‘fragmentation’ (whenever Jvm allocates memory, it must be contiguous blocks of memory). ‘OutOfMemoryError’ can also occur if ‘PermGen’ is full (the area of the heap where class objects and interned strings are stored).
7. You need to have some knowledge of the Application in order to successfully locate a memory leak
This is where things can get rusty. As an Admin, you can dig all you want with all the tools you have. But a little application specific knowledge will go a long way in finding the root cause. Make sure the developer of the application is involved in the troubleshooting process.
8. A heap histogram can be used to narrow down memory leak
A heap histogram can be useful as a starting point in troubleshooting memory leak.
Jmap –histo <pid>
Redirect the output to a file as the output can be pretty lengthy. The output will contain the class name, number of instances and sizes for each class in the memory. Take few histograms at few minutes interval and notice any trend.
9. There are Operating System tools to track Native memory leak
To tackle native memory leak, you need to turn to OS tools. On Linux, try mtrace. On solaris, try watchmalloc. On Windows look for /Md and /Mdd compiler options.
10. There are powerful third party profiles that you can use
If you are really serious about memory leak (why not?), you should turn to third party tools such as Quest Jprobe and Borland Optimizeit. They dig the living daylights out of Java memory and show you clearly what is going on. Note that profiling a Java application to track memory leak is a time consuming and iterative process. But it does work.
Memory Leaks are not fun. But troubleshooting them doesn’t have to be. Have fun cracking one of the toughest problems in managing Application performance. With patience and practice, you will be a master in no time J
Good luck!!
Comments on this entry are closed.