Custom Dashboard is one of the most powerful features of AppDynamics. It lets you group monitoring metrics that are relevant (and make sense to the user) in one central dashboard. Custom Dashboards are ‘read only’ elements. So, you don’t have to worry about users updating any Appdynamics configuration. You can build sophisticated dashboards with drill down capabilities.
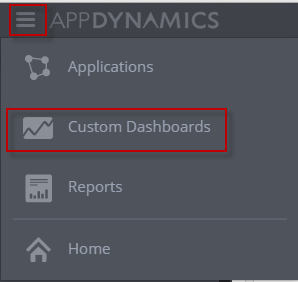
To create a new custom dashboard, click on the icon at the top and choose ‘Custom Dashboards’ as shown below
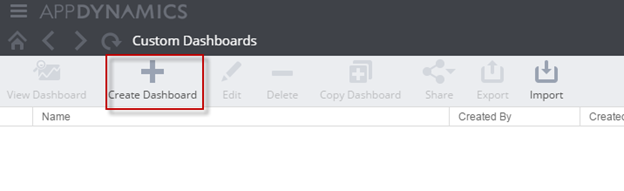
In the resulting screen, click on ‘Create Dashboard’
Provide a name for the dashboard and click OK
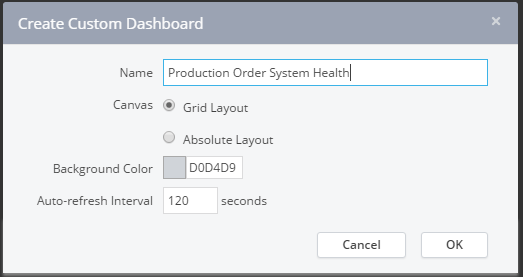
Let us say that you want to create a dashboard for keeping an eye on few critical metrics such as:
- Percentage Heap utilization
- Major GC time
- JDBC connection Pool utilization
- Average Response time of the Application
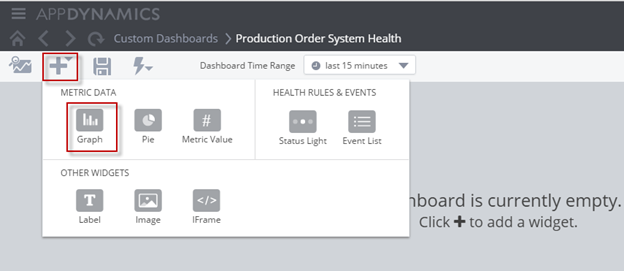
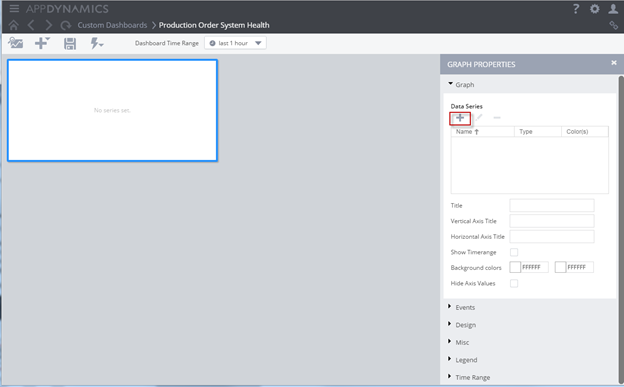
In the resulting screen, click on the ‘+’ symbol and choose ‘Graph’
Click on the + symbol as shown below
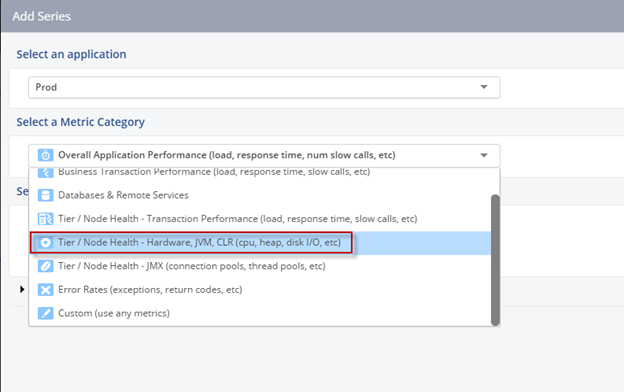
Choose the Application and Metric Category as shown below
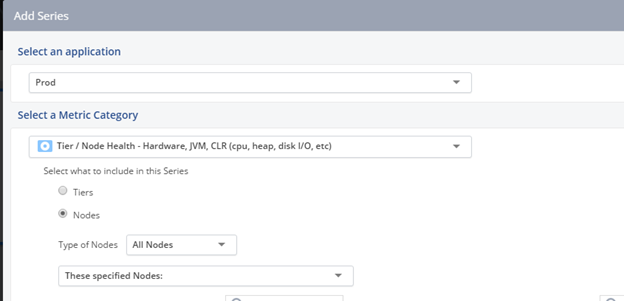
You can select what to include in this category. i.e A Tier or a specific node.
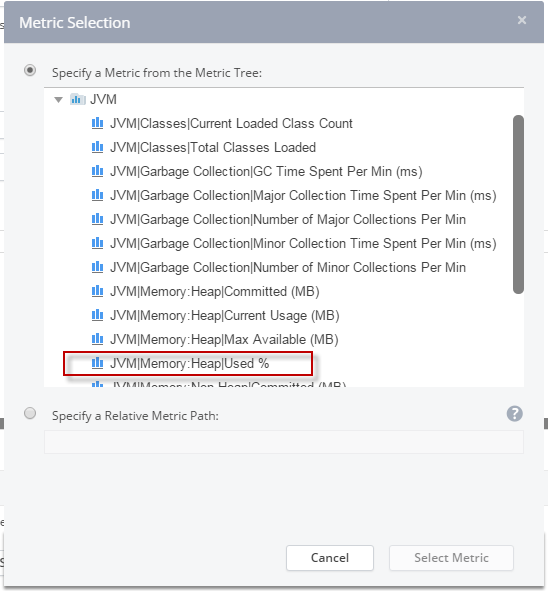
Click on ‘Select a Metric’ button and choose the metric as shown below
Click Save .You should see a dashboard like the one shown below
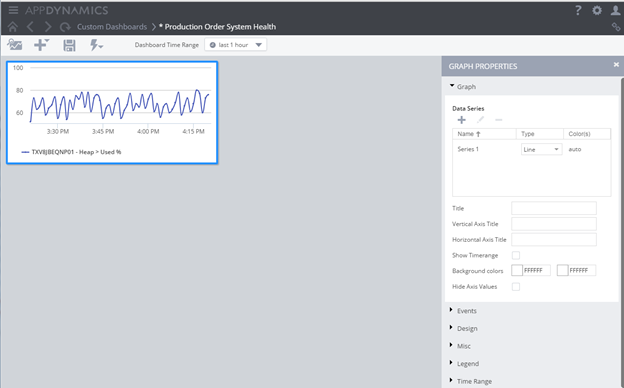
Note: you specify the time range for your dashboard at the top menu bar.
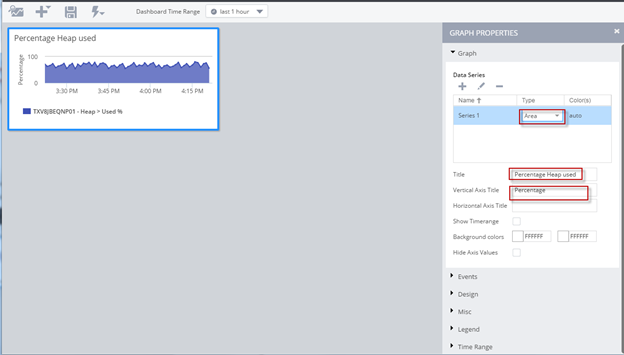
Further edit the values as shown below and click on the save icon
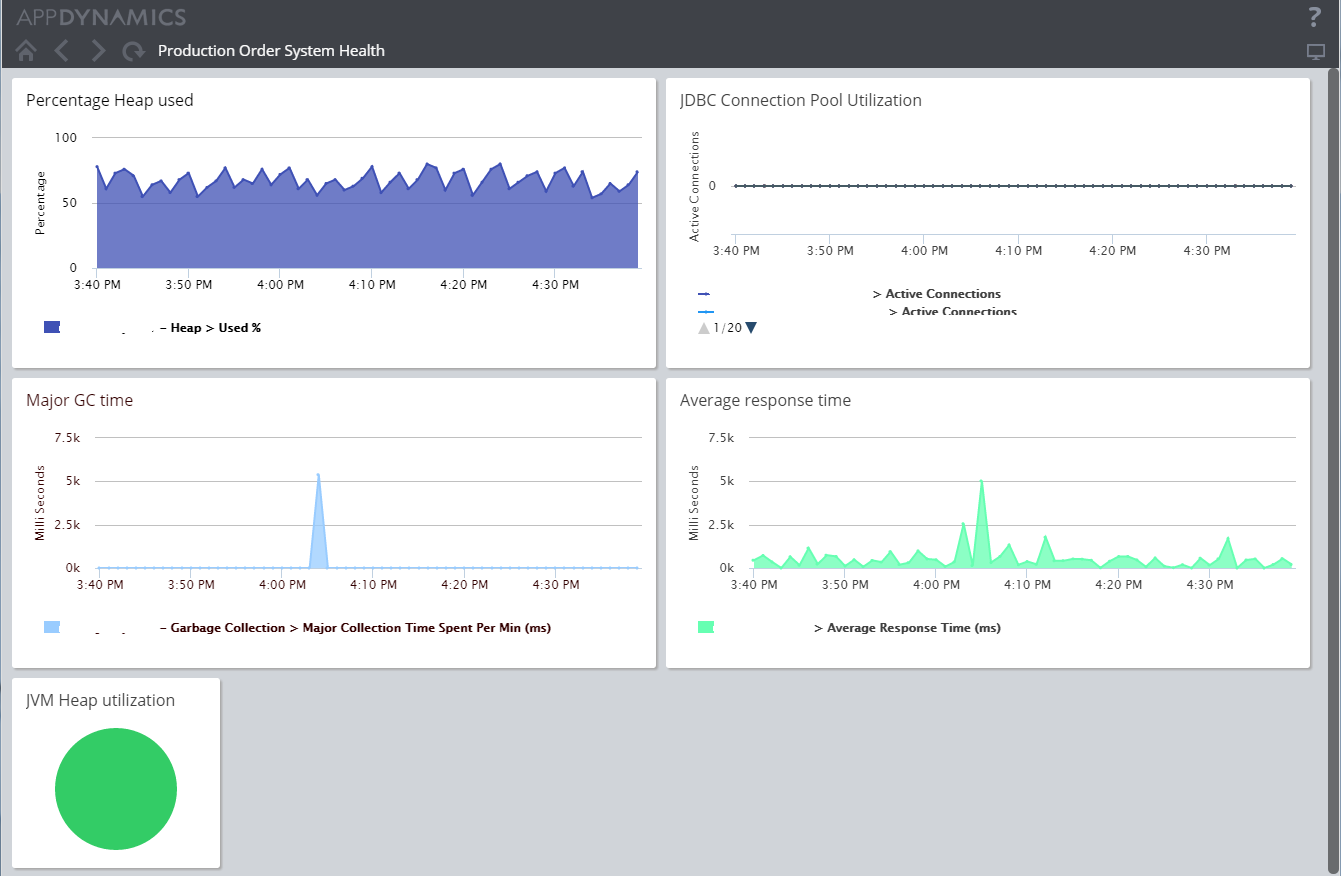
You can click on the + symbol again to add subsequent graphs. You can even create a traffic light that you can attach to a health rule. A finished dashboard can look something like this:
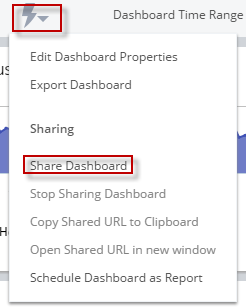
This is all great. But how to do make this dashboard available to the users ?
Piece of cake. Click on the Flash icon and choose ‘share dashboard’
Once done, you can share the URL to the dashboard. You can copy the URL to the dashboard by clicking on ‘Copy shared URL to Clipboard’.
Wouldn’t it be nice to add drill down capability to your dashboard? Sure. You can link any dashboard to any other dashboard by using the link option as shown below
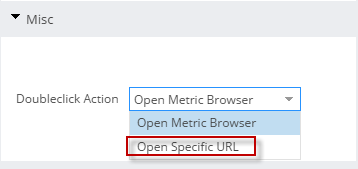
In Graph properties, under ‘Misc’, choose ‘open specific url’ and enter the URL to the drill down dashboard.
There you have it. Custom Dashboards are a powerful feature to get even more out of Appdynamics. Unleash your graphic talent and create breathtaking dashboards in no time. Yes, you can take all the credit J
Happy Monitoring!!
Comments on this entry are closed.