Okay. Now that you have some fundamentals drilled in, let us look at how exactly to take the Thread Dump. But even before that, let us answer this question:
Does taking Thread dump kill the Application Server? Are there any side effects?
When you take the Thread dump, the JVM is momentarily paused to dump the stack. This does mean that the JVM is interrupted. But that’s about the effect taking the Thread dump should have on the JVM – a momentary pause. However since it is somewhat intrusive process, there is an extremely rare possibility that it does something adverse to the JVM, like getting aborted. But in practice the cases like this are virtually none.
How do you take a Thread Dump of a JEE Application Server?
The procedure can vary greatly between Application Server Vendors and the Operating System in which the Application Server runs. Also, there can be more than one way to get the Thread Dump depends upon the Application Server.
Jboss
Windows
jstack –l <pid> > javacore.txt
<pid> is the Process id of the java process.
Jstack is a command that comes with JDK (6 and above)
Javacore.txt is the resulting Thread dump
Note: You may have to use psexec to run the jstack if you don’t have appropriate permissions.
Psexec –s jstack –l <pid> > javacore.txt
Psexec can be downloaded from Winsows Sysinternals Website. This somewhat similar to doing sudo in Unix.
Unix
jstack –l <pid> > javacore.txt
Or
kill -3 < pid>
<pid> is the Process id of the java process.
Jstack is a command that comes with JDK (6 and above)
Javacore.txt is the resulting Thread dump
With kill -3, the thread dump may go to the server.log
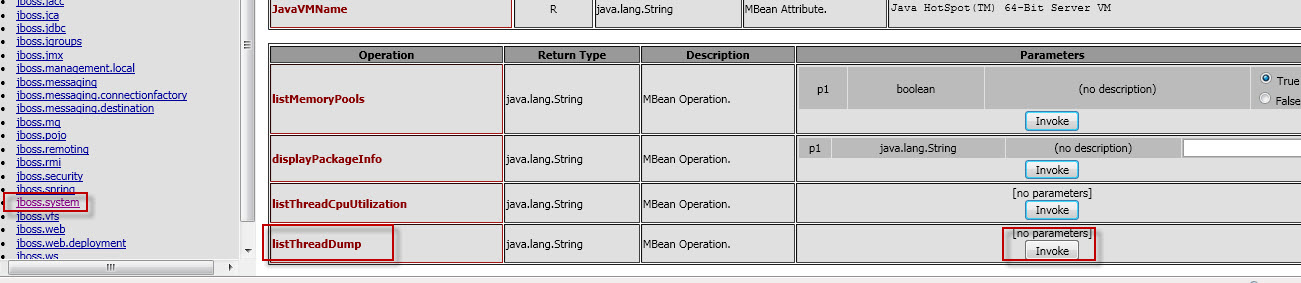
Note: You can also use the JMX Console to trigger a Thread dump. Navigate to ‘jboss.system type->ServerInfo’. Scroll down and click the ‘invoke’ button for the operation ‘listThreadDump’
WebSphere:
The jstack for Windows and ‘kill -3’ for Unix mentioned above in the ‘Jboss’ section will work for WebSphere as well.
In addition, you can use ‘wsadmin’ to trigger a Thread dump
<WSHOME>/wsadmin.sh -lang jython
wsadmin>serverProcess=AdminControl.completeObjectName(‘type=JVM,process=myServer,*’)
Replace ‘myServer’ with the Application Server name
wsadmin>AdminControl.invoke(server,’dumpThreads’)
The Thread dump will usually go to the Profile Home with a name such as javacore.date.time.processid.txt
WebLogic
The jstack for Windows and ‘kill -3’ for Unix mentioned above in the ‘Jboss’ section will work for WeLogic as well.
In addition there are several ways you can obtain Thread dump of a WebLogic Application Server. One popular way is to use WLST (Weblogic scripting tool)
Set the environment using setDomain.sh or setDomain.cmd
java weblogic.WLST connect(“<username>”,”<password>”,”t3://<url>:<port>”) threadDump()
The thread dump will be generated in Thread_Dump_<Servername>.txt
Note: If you are running Jrockit JVM, there is yet another easy way to take a thread dump. Just run
jrcmd <pid> print_threads
How many thread dumps do you need to take?
Very important question. You must always take at least three Thread dumps with 10 to 20 seconds interval. Why? This is how we can verify if a Thread is really stuck, by identifying the same Thread in all the three Thread Dumps executing the same line of code. Make sure you create Three different Thread dumps i.e. don’t overwrite the same Thread dump.
What do you need to look for in a Thread dump?
You got the thread dump. Now what do we do with it?. Most of us don’t have a clue on what to look in a thread dump and quite honestly there are not to be blamed. Thread dump will have 90% useless data. However, with practice you can quickly become a master of troubleshooting using Thread dumps.
The most important piece of information (often times, the only piece of information) you need to look for is the RUNNABLE THREADS. These are the threads that were executing in the JVM at the time of Thread dump. In Java, a Thread has various states as follows:
NEW: A new Thread. Not started yet.
RUNNABLE: A thread that is executing in the Java virtual machine.
BLOCKED: A thread that is blocked waiting for a monitor lock .
WAITING: A thread that is waiting indefinitely for another thread.
TIMED_WAITING: A thread that is waiting for another thread for a specified time.
TERMINATED: An exited Thread
Note: The above states are Oracle HotSpot JVM specific. Jrockit JVM, for example has states such as ‘alive’ and ‘parked’. And IBM JVM has states like ‘zombie’ and ‘suspended’.
In the next part, we are going to look at the fun part:
Step by Step procedure to analyze a Thread dump
Using Free tools to analyze the Thread dump
Answer all the burning questions that we asked at the beginning of part1
Stay tuned.
Note: For more time saving tips and education, subscribe using the ‘subscribe’ form on the home page.
Unix Script: jstack-thread-dump.sh
for ((a=1; a thread-dump.$a; sleep 1; echo $a; done
https://gist.github.com/walquis/4346882#file-jstack-thread-dump-sh
Windows Script: threaddump-windows-jstack.bat
REM The following batch script generates 6 thread dumps at a preset interval of 20 secs
REM script can be executed as
REM threaddump-windows-jstack.bat 2120
REM where 2120 is the java process id
for /L %%i in (1,1,6) do (
echo Taking Thread Dump %i
jstack -l %1 > thread-dump-%%i.txt
timeout 20
)
https://gist.github.com/poornan/f9bf7f5cf1e553b8ec5f49a398a5e6dd#file-threaddump-windows-jstack-bat
Great. Thank you.