by Karun Subramanian
on July 6, 2016
Yes, AppDynamics is awesome for Application monitoring – Java Heap, deep transaction tracing, tons of out-of-the-box framework monitoring (JDBC,WebService etc) and the list goes on. But do you know Appdynamics can be used to effectively monitor Servers too, whether it is virtual or physical? When I say server, I mean the host operating system such as RedHat Enterprise Linux, Windows 2012, Solaris etc. Let me show you how you can do this.
Enter AppDynamics Machine Agent
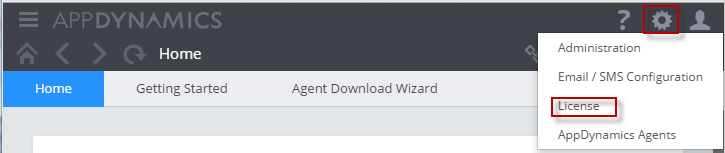
While Java can be monitored using a Java Agent, a Server can be monitored using a special type of agent called Machine Agent. You will have to have license to run these agents (When you purchase Application agents, typically AppDyanmics throws the same number of Machine Agents, and so you should be good in terms of additional cost). If you are not sure about your present licensing situation, click on ‘licensing’ in your Controller UI as shown below.
Unlike Application agents which run inside the JVM/CLR, Machine agent is a standalone Java program that runs on the host operating system. It collects hardware metrics and sends them to Controller (once a minute). A user can view these metrics via Controller UI. Pretty simple, hah?
Read More
by Karun Subramanian
on July 4, 2016
Java Heap is a labyrinth. You can spend hours or even days analyzing a heap dump from a production Java application. Heap is where all the objects created by your application live. And even in a relatively simple application, there could be hundreds of thousands of objects created. When dealing with Java memory leak, you know you are looking for one the following (or both):
- Excessive number of objects of certain class
- Objects with unusually large size
Fortunately, Appdynamics provides a feature using which you can easily reveal both of the above cases. Let’s get right to it.
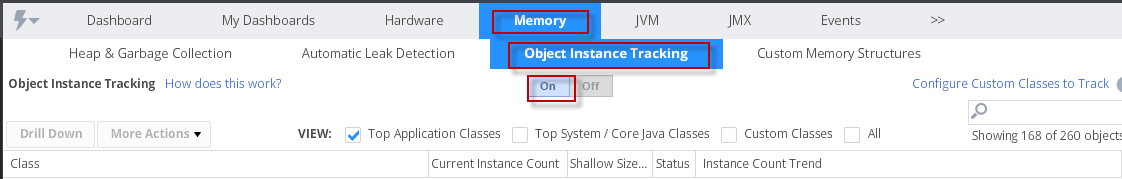
- In AppDynamics Controller UI, locate the Node that you want to troubleshoot and click on ‘Memory’ tab
Read More
by Karun Subramanian
on July 4, 2016
In this part, let’s explore AppDynamics facilities for diagnosing Memory Leaks. AppDynamics provides two powerful tools to hunt down memory leaks.
- Automatic Leak Detection
- Objet Instance Tracking
Automatic Leak Detection
With Automatic Leak Detection enabled, Appdyanmics can capture objects that live longer than usual period – i.e long lived Collection objects that simply won’t get garbage collected. If your application is leaking memory, it is definitely one of these long-living, never-dying objects that cause the leak. Use the following procedure to make use of this tool.
Read More
by Karun Subramanian
on May 11, 2016
Troubleshooting JVM memory issues can be daunting, but you if you don’t fix it, it can kill your application and possibly your face in front of your customers. There is good news though. With any modern APM tool, you virtually get an X-Ray vision to this labyrinth named Java Heap.
In this blog post, I’ll show you how to use AppDynamics to troubleshoot Java memory issues.
AppDynamics is one of the leading APM vendors in the market, providing tons of useful tools ranging from Hardware monitoring to End user experience monitoring to operational data analytics (Actually it can be quite overwhelming. If you don’t know what exactly you are looking for in the tool, you can go in circles. But don’t worry, I can help).
There are three major areas where AppDynamics can help in regards to Java memory troubleshooting.
Read More
by Karun Subramanian
on February 12, 2016
Custom Dashboard is one of the most powerful features of AppDynamics. It lets you group monitoring metrics that are relevant (and make sense to the user) in one central dashboard. Custom Dashboards are ‘read only’ elements. So, you don’t have to worry about users updating any Appdynamics configuration. You can build sophisticated dashboards with drill down capabilities.
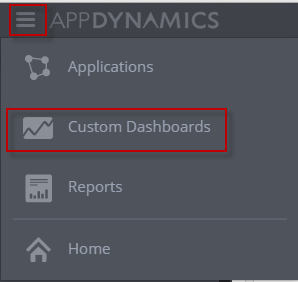
To create a new custom dashboard, click on the icon at the top and choose ‘Custom Dashboards’ as shown below
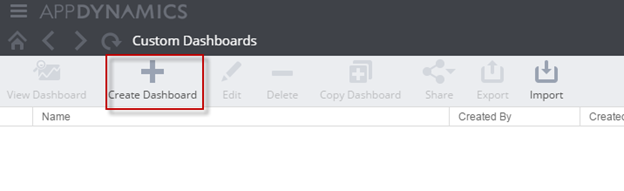
In the resulting screen, click on ‘Create Dashboard’
Read More
by Karun Subramanian
on January 6, 2016
Agent is a vital part of Appdynamics framework. It is the agent that acts like a workhorse to pull metrics from the Application and push it to the Controller. Agent is a piece of software that is installed ON your application. The only function of the agent is to pull the monitoring metrics and send them to the AppDynamics Controller where the data is crunched and made available via the Controller UI. Note that there is NO need of a code change in your application. There is however a setup/configuration change required depending on the platform. In this article, I will explain how to instrument a Java Application.
Read More
by Karun Subramanian
on December 25, 2015
What good is an APM solution without a solid Alerting system that is easy to configure? Appdynamics alerting system is very robust with lots of options to customize.
First of all, AppDynamics comes with several pre built alerts with thresholds that are dynamically learned. This means without configuring anything, you get out-of-the-box alerting. This default alerting is visible in the Dashboard via the coloring scheme (for example, a node icon turning RED). However, the default alerting is not enough for most cases. You would want to customize the default ones, and perhaps add your own.
Two major components of Appdynamics Alerting system
Read More