Java Heap is a labyrinth. You can spend hours or even days analyzing a heap dump from a production Java application. Heap is where all the objects created by your application live. And even in a relatively simple application, there could be hundreds of thousands of objects created. When dealing with Java memory leak, you know you are looking for one the following (or both):
- Excessive number of objects of certain class
- Objects with unusually large size
Fortunately, Appdynamics provides a feature using which you can easily reveal both of the above cases. Let’s get right to it.
- In AppDynamics Controller UI, locate the Node that you want to troubleshoot and click on ‘Memory’ tab
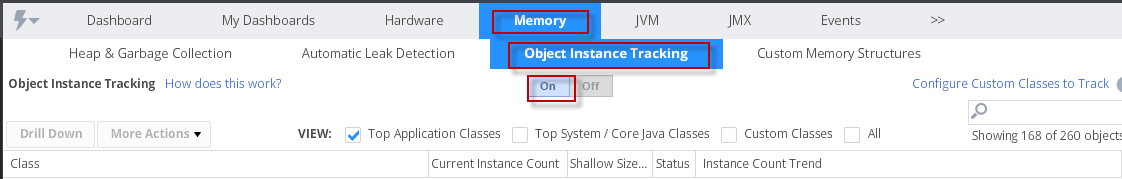
- Click on ‘Object Instance Tracking’ tab
- If not enabled already (greyed out), click on ‘On’. This enables object instance tracking.
You may see a warning message as shown below:
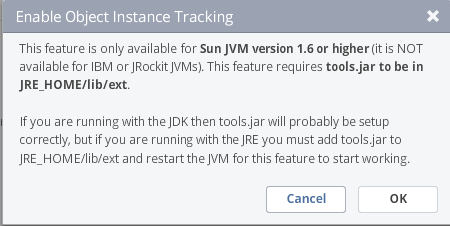
Click OK. (Sorry: This option only available from Sun/Oracle JVM 1.6 and above).
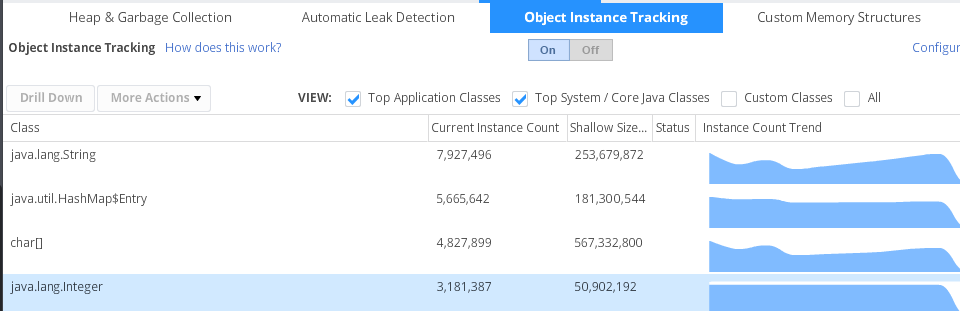
- Sit back and wait. Appdynamics will start accumulating stats about the objects and will soon starts displaying. In an hour or so, you should have some good data to begin with.
Appdynamics will display top Application classes. You can also click on the check box ‘top System/core java classes’ to see java core data type objects (such as int, char etc). But these are seldom useful as they don’t necessarily point to the root cause
How can I configure custom classes (ie. My application classes) to be tracked?
Glad you asked. If you want to find out if a specific class (or classes) is being instantiated huge number of times, or if you want to track the size of an object, you can instrument that specific class(s). To do so, click on ‘Configure Custom Classes to Track’ link
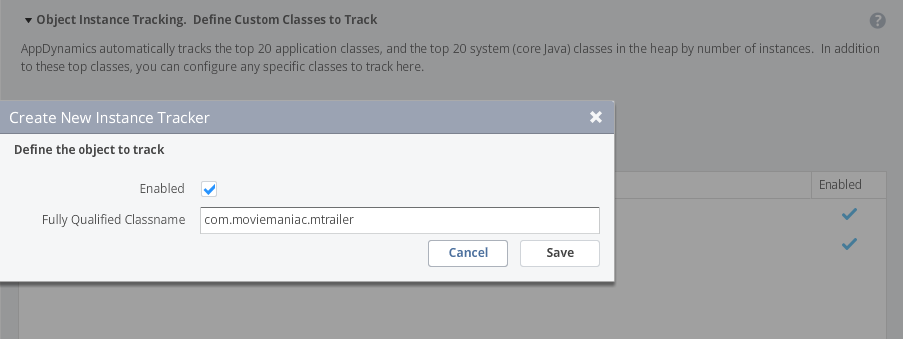
In the resulting window, click ‘Add’ and type the fully qualified classname and click ‘Save’. You are done.
Note that Appdynamics automatically tracks top 20 Application and system classes. What you configure here is in addition to those classes.
I recommend leaving the ‘Object instance tracking’ for a day or two for better diagnosis. Pay attention to the ‘Instance Count Trend’ as it may show a slowly increasing pattern. (smell the leak ??)
There you have it. With these powerful features (Automatic Leak detection, Object Instance Tracking and Garbage Collection), you are equipped with tackling even the most complex Java memory leak issues.
Note: There is also a feature called ‘Custom Memory Structures’ monitoring. This is same as configuring custom application classes to be monitored in ‘Object Instance Tracking’ screen.
Happy Leak Hunting!!
Comments on this entry are closed.