by Karun Subramanian
on May 30, 2017
Few errors are deadlier than java.lang.OutOfMemory errors. When this happens, you application will run into a very unpredictable state, often hanging up and not processing new requests, coughing up ugly stack traces into users browsers etc. The most popular (and effective in the short run) fix for OutOfMemory error is simply restarting the Application or Application Server.
While running out of java Heap is the most common OutOfMemory error, there are indeed several types of OutOfMemory that can occur. In this post, I will show you these various types of OutOfMemory errors and what they mean.
java.lang.OutOfMemoryError: Java heap space
The most popular one. This is when JVM goes belly up and unable to allocate memory in Heap . Your application might appear hung up and extremely slow to respond to user requests.
For example, let’s say your Java application has 2GB of memory maximum (through -Xmx flag). When the entire 2GB is used up and GC is unable to reclaim any memory, the next memory allocation request for an object will fail with java.lang.OutOfMemory Error.
What causes java.lang.OutOfMemoryError: Java heap space ?
Read More
by Karun Subramanian
on May 29, 2017
Java 9 is supposed to be released in summer 2017. The biggest changes appear to be around modularization which enables you to create, build, deploy and reuse modules of code. There is also the new jshell command line tool that lets you test snippets of code quickly. From Application support standpoint, I see one major change in memory management and that’s what I want to discuss today.
GC (Garbage Collection) is the bread and butter of Memory Management in java. GC is responsible for cleaning up dead objects from memory and reclaiming that space. GC executes its cleanup using predefined Collectors that use certain algorithm(s). As I mentioned in my previous post, there are 4 Collectors that can be used.
- Serial Collector
- Parallel Collector
- CMS (concurrent Mark and Sweep) Collector
- G1 Collector
Until Java 1.8, on Server class machines (2 CPU and 2GB RAM minimum. Humor me if your server is leaner than this size), the default collector is Parallel collector.
Parallel collector is all about throughput. It does not care about having longer GC pause times (as it will stop the application threads before performing a GC). If you cannot tolerate long GC pause times (upwards of 1 second), you could choose CMS collector.
G1GC was introduced in Java 1.7 to address both increased throughput and decreased GC pause times overall.
Here is the major change with this edition of Java. G1GC is the default collector in Java 9.
Read More
by Karun Subramanian
on May 25, 2017
In this post, I’m going to explain how Heap is organized using generations and how Garbage Collection works behind the scene to free up memory. Java memory management has evolved a lot over the past few java releases. Understanding the mechanics underneath will help you better tune it (if required) to suit your needs.
When your java application runs, it creates objects which takes up memory space. As long the object is being used (i.e referred by the application somewhere), it is going to occupy the memory. When the object is no longer used (for example, when you cleanly close a DB connection), the space occupied by the object can be reclaimed by Garbage collection.
What are generations ?
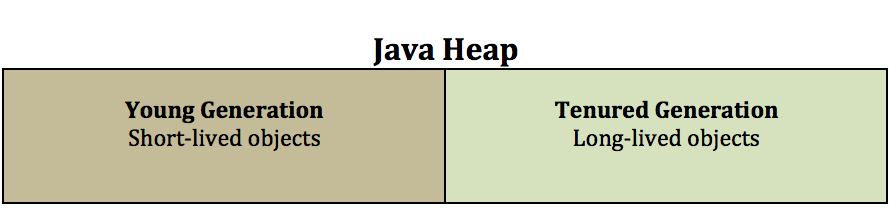
Java heap is typically divided into two major pools. An area where short-lived objects live. And an area where long-lived objects live. Young generation (aka Nursery aka Eden) is the place for short-lived objects and Tenured generation (aka Old) is the place for long-lived objects.
Why Generations ?
Read More
by Karun Subramanian
on May 22, 2017
Heap is the memory space where java application objects are stored. Unfortunately the size of Heap is limited (by the -Xmx java command line option). When all of heap is used up, you are in deep trouble. So, it helps to understand how to measure Java heap usage, and that’s exactly what I’m going to be discussing with you in this post.
Very surprisingly, measuring heap is not that straight forward in java world. I believe it is due to the fact there are numerous ways to measure java heap. Oracle seems to introduce new tools with every release (and retire the old ones). For this reason, I recommend everyone to invest in a commercial grade APM (Application Performance Management) tool. With APM tool, you will simply login to the APM interface (typically a web application) to view the JVM heap usage (along with tons of other useful metrics)
Using the command jcmd to measure heap usage
Java comes with a command line tool named jcmd. It should be available in most flavors of Java (Oracle, IBM etc). I’m going to recommend jcmd to measure your heap usage. One of the advantages of using jcmd is the class histogram which not only shows the heap usage but it breaks down the usage by class. This gives you an instant view of what is causing heap to fill up.
Important Note: jcmd does have some impact on the jvm. But I assure it is worth the price, as the details shown by jcmd are very valuable.
Important Note: the command jcmd must be run as the same user (or effective user) as the user running the java application
Let us see jcmd in action.
Read More
by Karun Subramanian
on April 20, 2017
By default, AppDynamics captures tons of useful metrics from your java application. Average response time of your Applications, JDBC response times, Throughput, Heap and Garbage Collection Metrics etc. In addition, AppDynamics automatically captures Transaction Snapshots (that provide deep diagnostics) periodically and during slow response times. The snapshots will reveal the hotspots up to the method level.
But at times, you may want to monitor a particular method for performance metrics. For example, you may want to know how often a method named ‘cancelOrder’ is called and how long it takes to process. For requirements like this, AppDynamics provides a neat way of instrumenting your java method – Information Points.
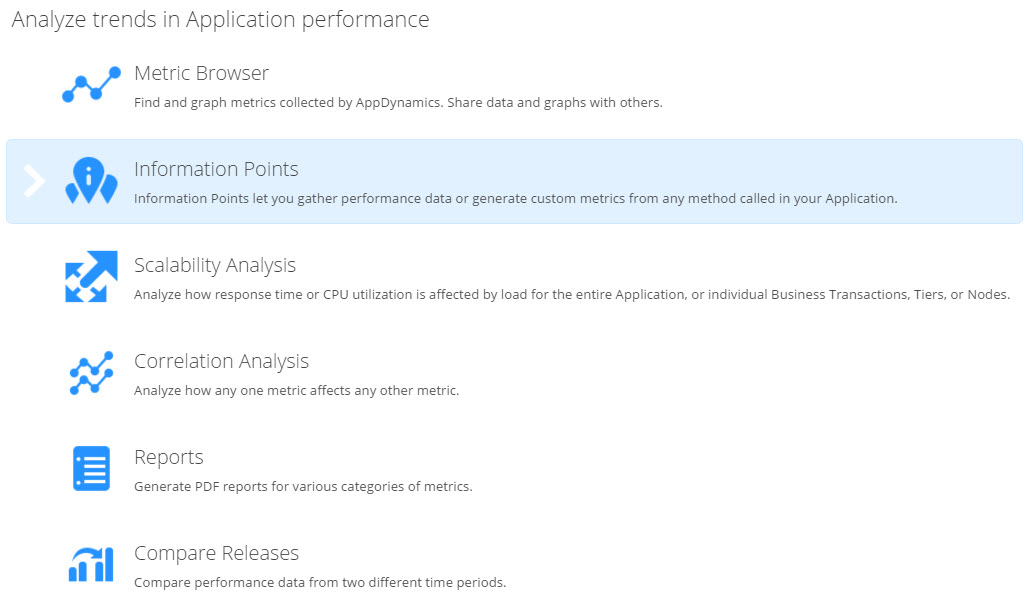
To configure a new Information Point, navigate to Analyze -> Information Points. Click on the New button at the top.
Read More
by Karun Subramanian
on April 20, 2017
One of the major uses of an APM such as AppDynamics is the ability to collect application data at method level. For example, let’s say you have a method named processOrder in your code that accepts OrderID and Username as parameters. What if you want to capture the Username as part of the performance metrics ? This can be extremely valuable, for instance, to identify which user could be submitting orders that are very slow to process. In AppDynamics, you can achieve this by using Data Collectors. In this blog post, let me show you how it is done.
- Log on to AppDynamics Controller UI
- Navigate to Configuration -> Instrumentation and click Data Collector tab
- You have two types of Data Collectors to choose from
- Method Data Collector – Captures method arguments and return values.
- HTTP Data Collector – Captures URLs, Headers and Cookies
- Click on Add under the Method Data Collector
- Configure the Method Data Collector as follows
- Name: Provide a meaningful name for this Data Collector
- Select Apply to new Business Transactions. If you don’t select this, you have to manually select the Business Transactions.
- Provide the method signature (identifying a method) by its fully qualified class name and method name.
- If the method is overloaded, i.e the same method name with various arguments, you need to select Is this Method Overloaded check box and choose the method signature you want to monitor
- Optionally specify match condition to choose the method
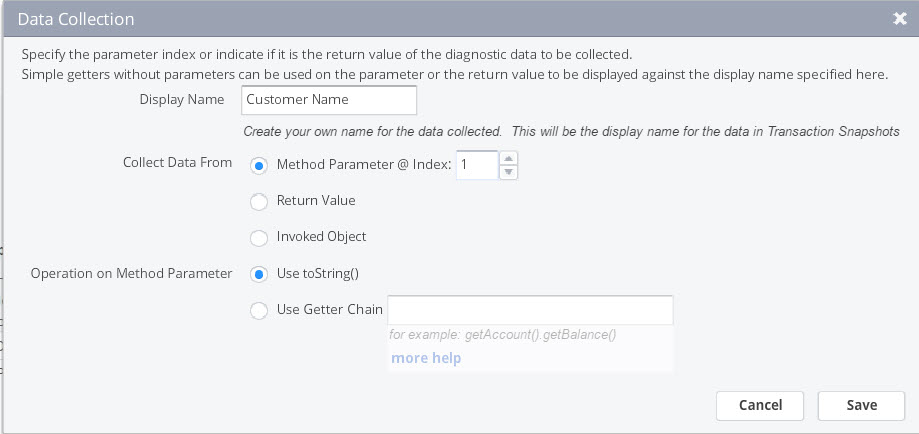
- Under Specify the data to collect from this Method Invocation, enter a display name (this is the name that will show up in Transaction Snapshots under User Data) and the data to collect. You can collect method arguments and/or return values
- Note that you can also configure HTTP Data Collector if you wish you capture HTTP metadata such as URLs, Cookies and Header values.
Read More
by Karun Subramanian
on January 3, 2017
Glad you are here. It’s time to take a deeper look at all the various monitoring metrics that AppDynamics provides. We have so far done the following:
- Installed AppDynamics Controller
- Installed a sample application (Node.js,REST and mysql) and installed appdynamics agent
- Ensured the application shows up in the controller UI.
Note that we have not customized any monitoring elements yet. i.e whatever we are going to see is out-of-the box, which is one of the coolest things about AppDynamics. Let’s start.
How to view the Flow Map of the Application ?
Application flow map provides an excellent view of the data flow of the application. AppDynamics automatically tracks all the inbound and outbound calls of the instrumented application and attempts to draw this flow map. It is like an interactive Visio Diagram of the application infrastructure architecture that you did not create. (AppDynamics created it for you). Let’s take a look at the Flow Map of the sample application we have instrumented.
Read More
by Karun Subramanian
on January 2, 2017
So you have installed AppDynamics Controller, instrumented a simple Java Application and even viewed it from AppDynamics Controller UI. You have come a long way. Excellent work! In this blog post, I’ll take you a step further by showing you how to view critical Application Metrics in the UI. In order to get to see various monitoring metrics, let us use a more sophisticated application (one with a backend database).
Fortunately a sample application is available at github specifically for this purpose. Kudos to the developers who made this available to all of us. The application is based on Docker (no surprise there) so you need to have Docker installed in your server that you are planning to use as the Application host. If you don’t want to go this route, simply instrument one of your applications (preferably in Dev environment).
Here are the steps to install the docker based sample application.
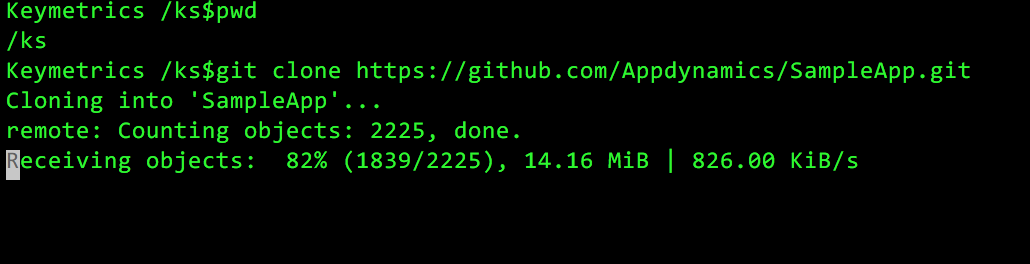
- Clone the git repo
git clone https://github.com/Appdynamics/SampleApp.git
Read More
by Karun Subramanian
on December 29, 2016
Now that you have your AppDynamics Controller up and humming, the next step is to instrument an Application to see the awesomeness of AppDynamics in practice.
For this blog post, I’ve chosen a very simple Java Web Application running on a tomcat server (It is the ‘sample’ application that comes with tomcat). The instrumentation process is fairly straight forward. While what I’m about to show is fairly manual, in real world scenarios involving hundreds of servers, you will be using some sort of automation 🙂
At high level, here is the procedure:
- Download the agent software either from the controller UI, or from appdynamics website
- Copy the agent software to the target application server (which is to be instrumented)
- Update the java command line that starts the application to instrument AppDynamics and restart the Application Server.
Ready ? Let’s get started.
Read More
by Karun Subramanian
on December 27, 2016
OK. So, you want to get AppDynamics controller installed on your Mac. Perhaps you want to test the awesome power of AppDynamics locally before purchasing the product. Great. In this blog post, I’m going to show you how to get AppDynamics Controller installed on your Mac. Let’s get to work.
- Login to https://aperture.appdynamics.com/download/
- Scroll down on the left pane and select the Mac check box
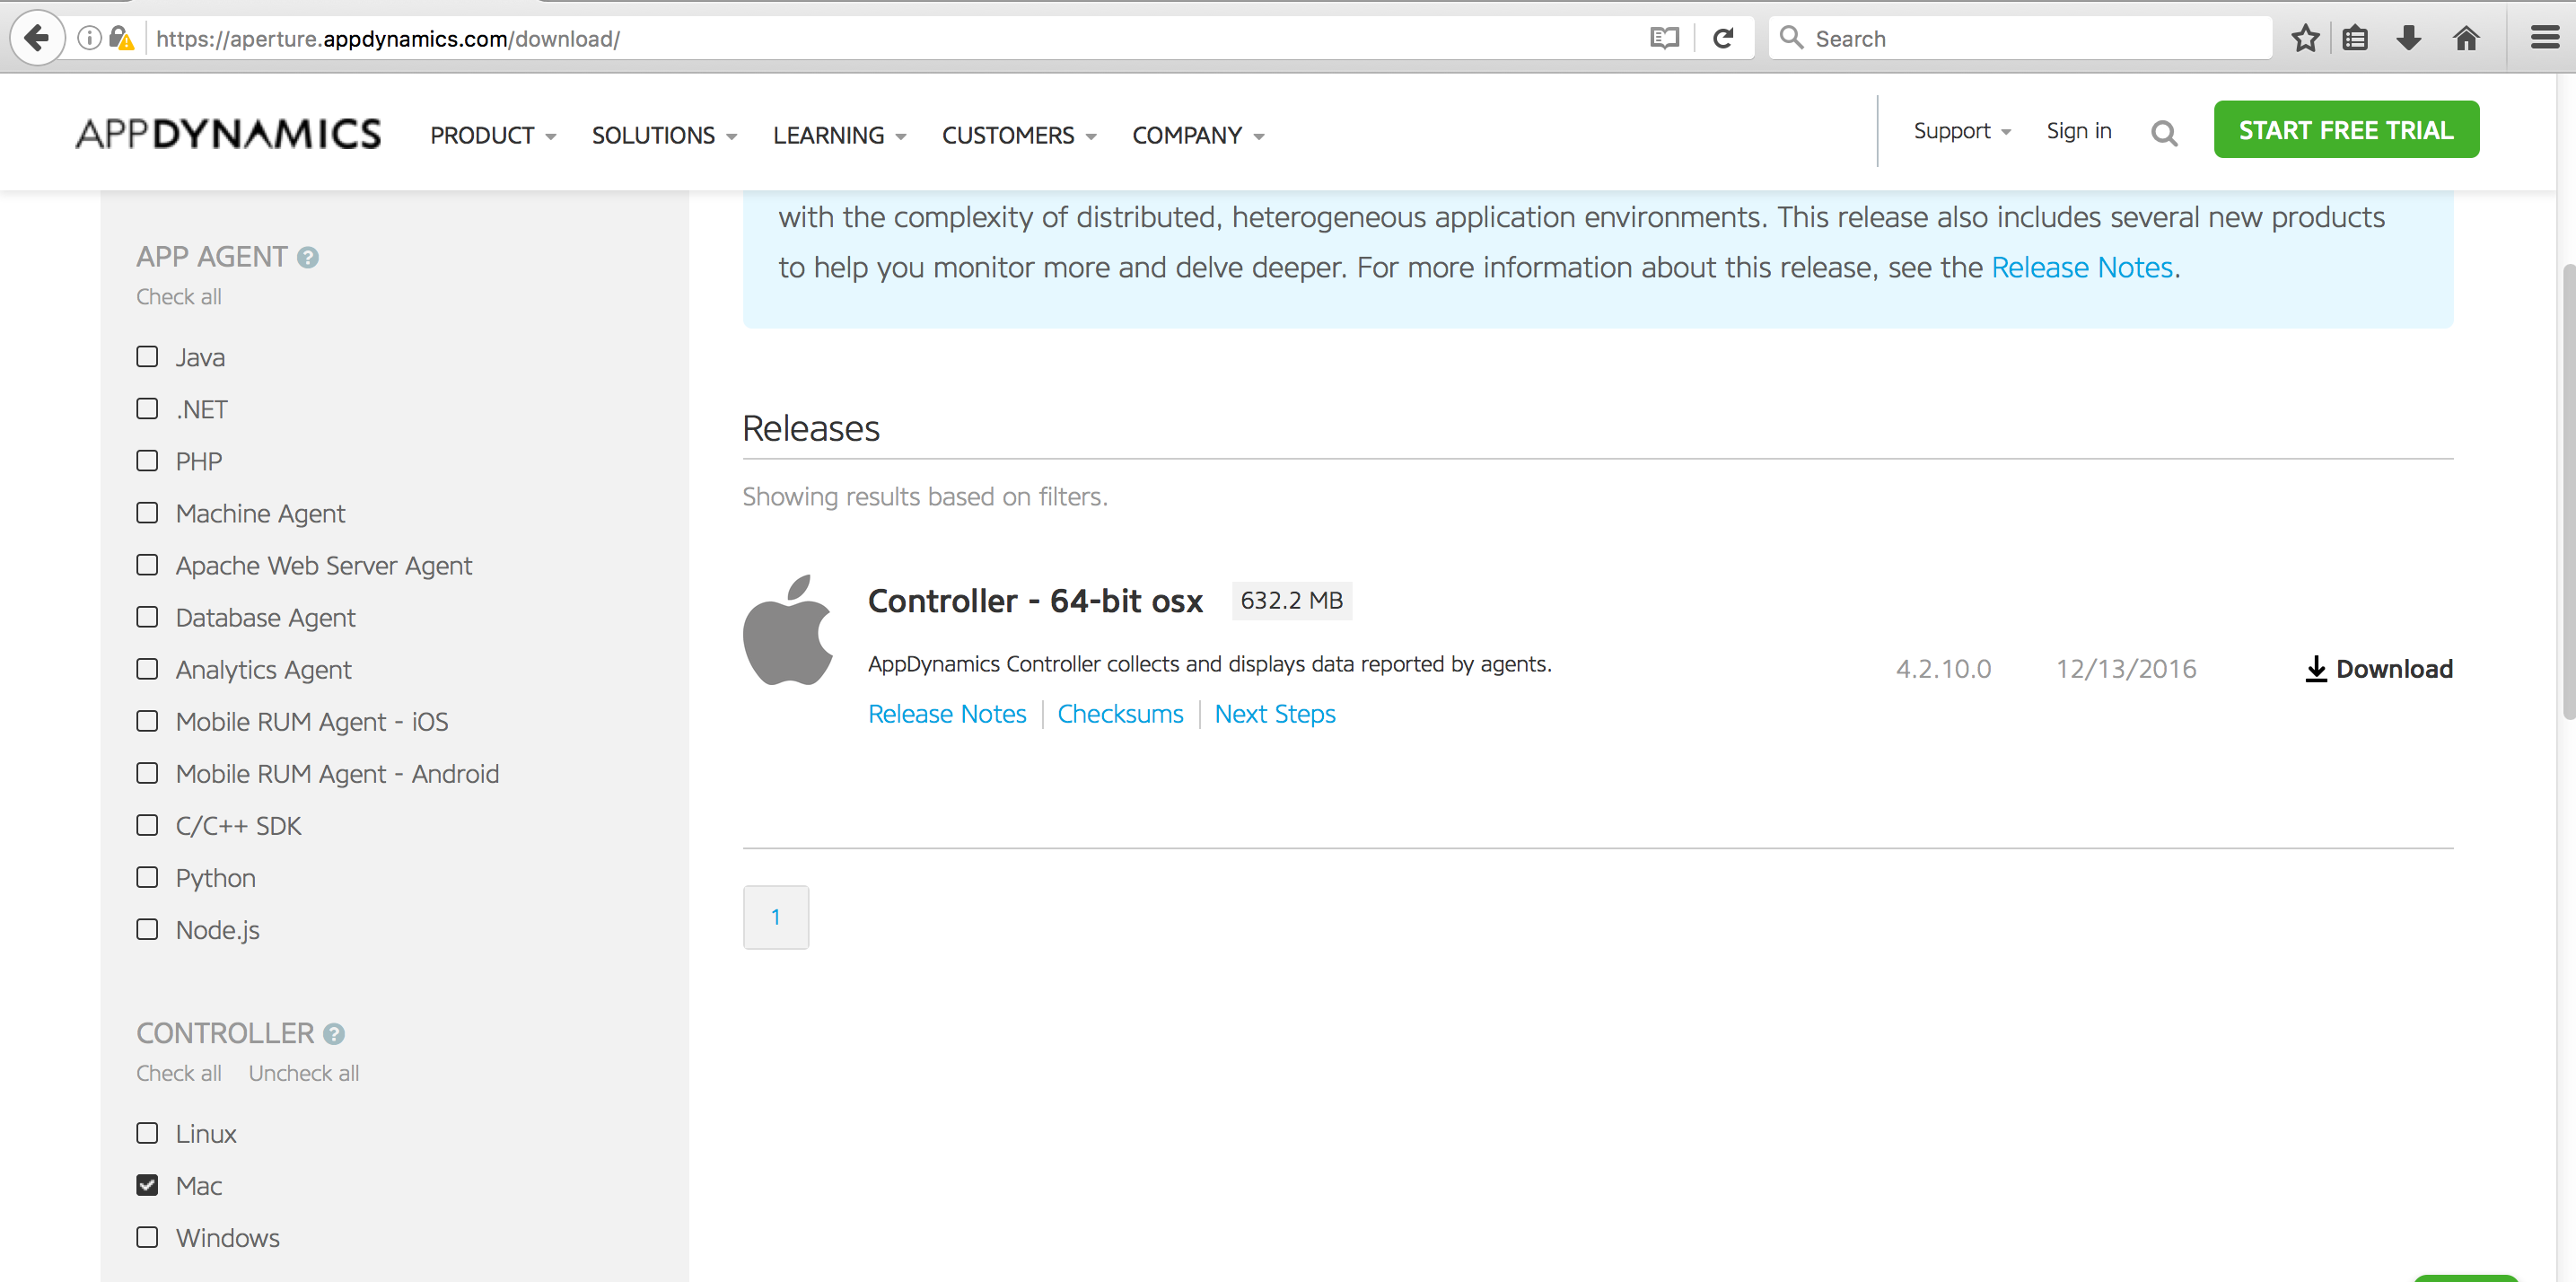
Read More