If you are new to Spunk, you’ve probably seen the Search Mode option in the search interface, and wondering what in the world is Search Mode. Even some of the experienced Splunkers don’t fully understand the search modes. May be you run all of your searches in the verbose mode (not recommended), or may be all in fast mode (not recommended), or you want to play it nice and use smart mode (recommended, may be). By reading this blog post, you will fully understand what these search modes actually mean and thereby will be equipped to make the right choice. You can also find a video with demo at the end of this post. Let’s get started.
Search Modes
In Splunk search interface, the Search mode shows up right underneath the time picker. See figure 1.
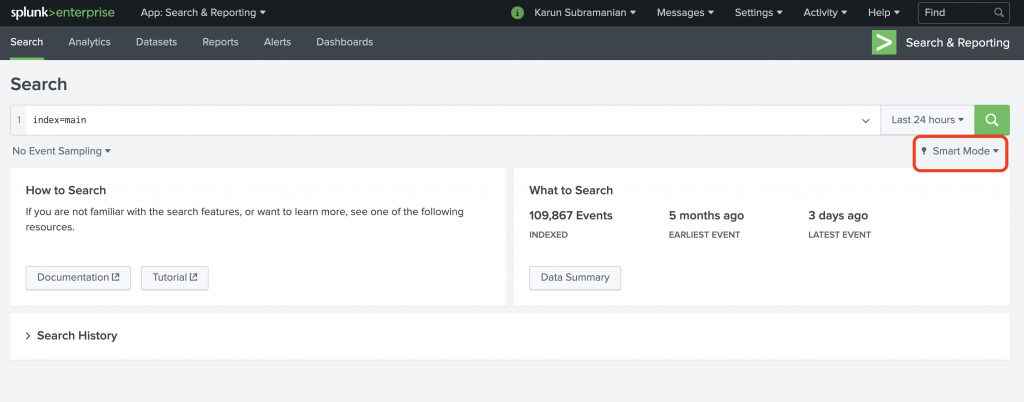
Figure 1: Search Mode in Splunk search interface
When you click on the drop down arrow, you are provided with three options.
Fast Mode
Smart Mode
Verbose Mode
See Figure 2.
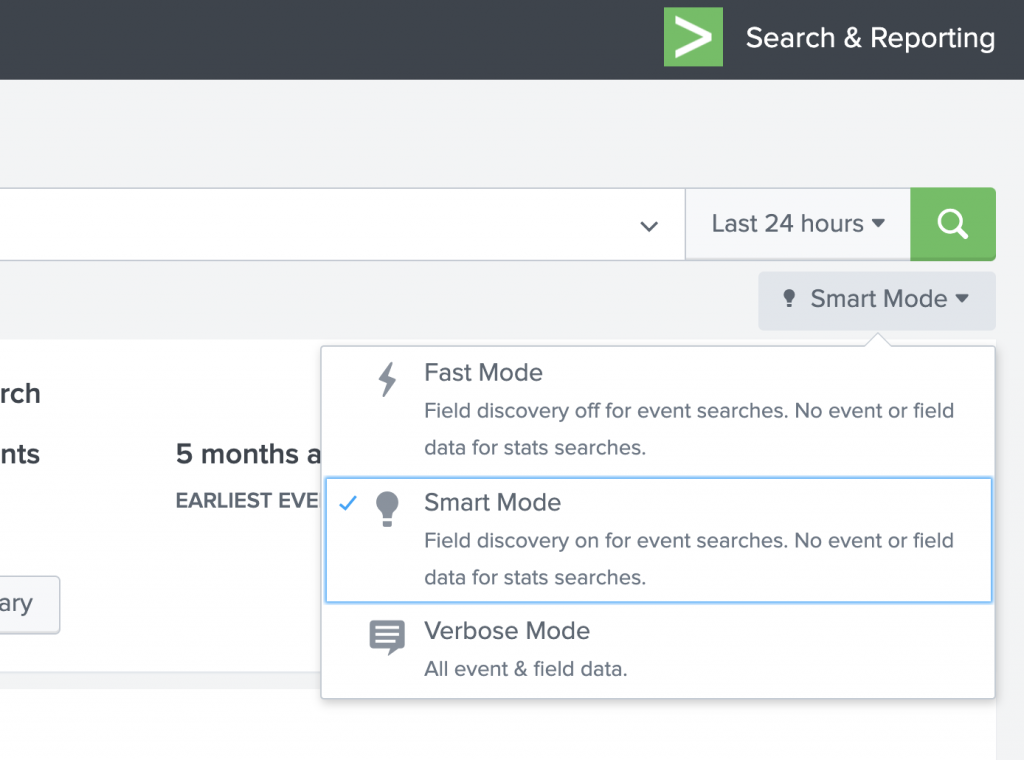
Figure 2: Search modes available
Why Search Modes?
You might be wondering, why do we need the search modes in the first place? Good question. The answer is of course, to make your searches fast and complete. What do I mean by that?
When you run a search, Splunk let’s you choose what to emphasis – speed of the search, or completeness of the search. When I say ‘completeness’, I mean the field extractions, and the availability of event data in reporting/statistical searches. There are two areas where the search modes come in to play.
- Does the field discovery (automatic field extraction) run when the results are loaded?
- Are the events data available after a reporting/statistical is run?
Let me elaborate in detail.
Fast Mode
Fast Mode gives emphasis to, well, being fast. It turns off automatic field discovery so that the results can be loaded quickly. Also, for a reporting/statistical command, fast mode does NOT retain the events data. If you all need is a fast search without having to rely on automatic field extraction, go for the Fast Mode.
In Figure 3, a Fast mode search shows that the only fields available are the default meta fields such as host,source,sourcetype,index, linecount and splunk_server. I used the Splunk tutorial data for this.
index=main sourcetype=access_combined_wcookie
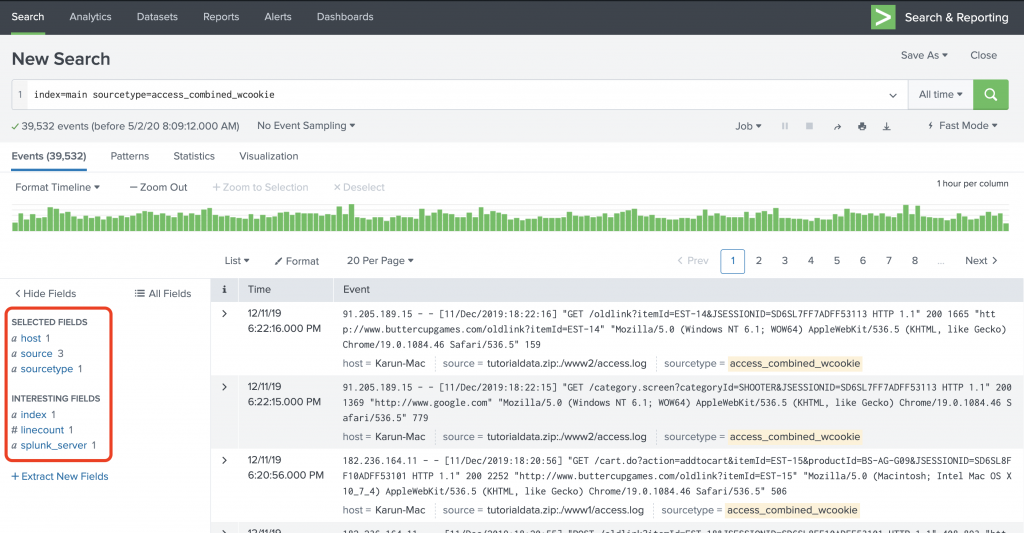
Figure 3: Fast mode search
The search finished in 0.817 seconds.
When I run a statistical command in Fast mode, I just see the statistical output but not the event data. See Figure 4 and Figure 5.
index=main sourcetype=access_combined_wcookie
| stats count by status
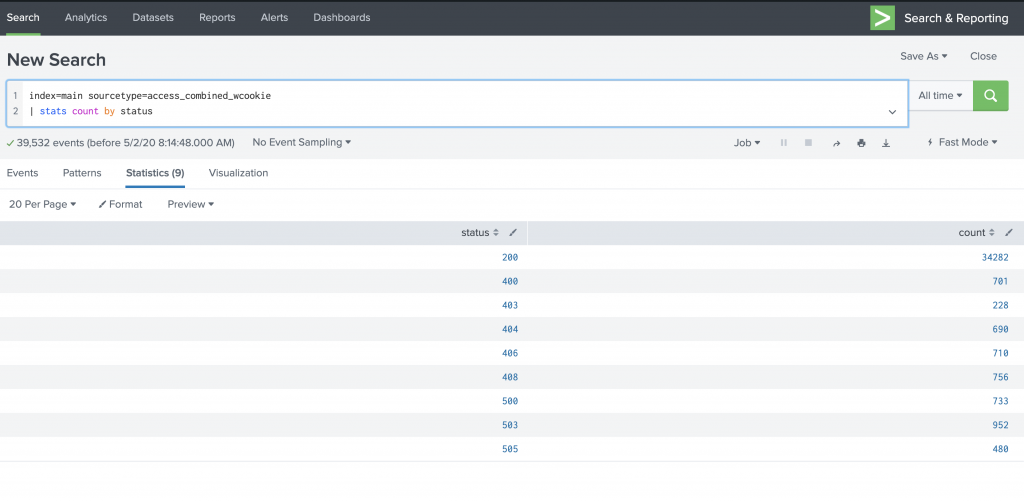
Figure 4: Running a statistical command in Fast mode
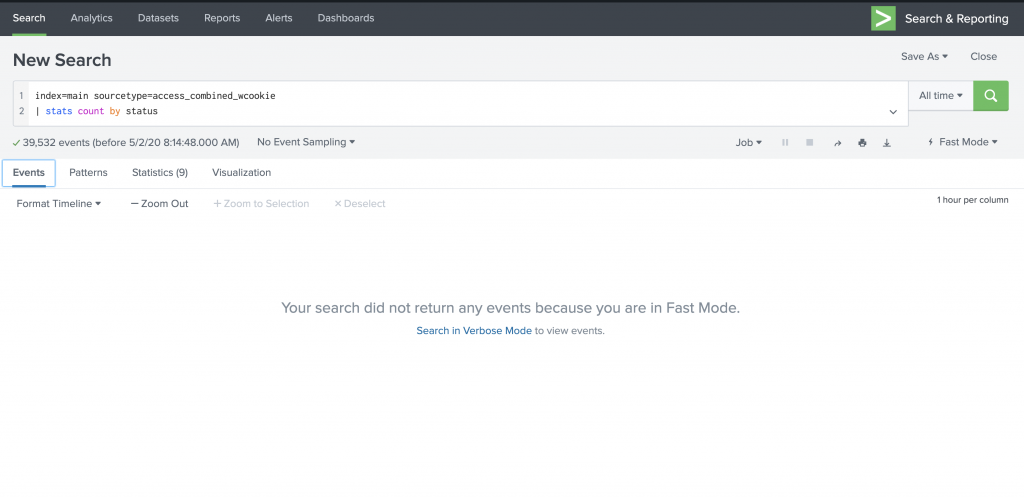
Figure 5: The Events tab is empty when you run statistical/reporting commands in Fast mode.
Now let’s see how Verbose mode fares.
Verbose Mode
Verbose mode is the opposite of Fast mode. It gives emphasis to the completeness of the search results, at a cost of search speed. In verbose mode, automatic field discovery is on to fetch as many fields as possible and make them available in the Fields sidebar. Figure 6 shows the output of the search in Verbose mode.
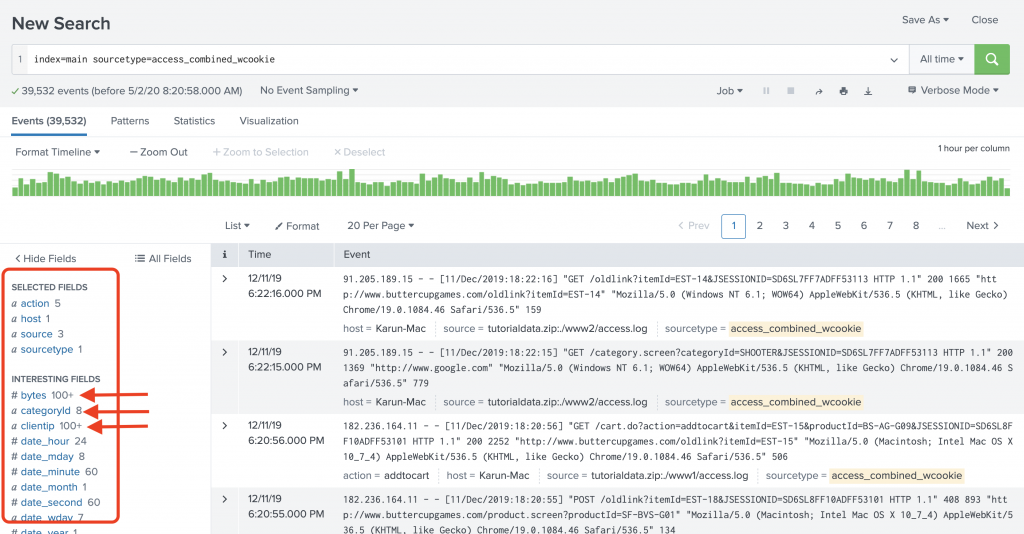
Figure 6: Verbose mode search
Nor surprisingly, the search finished in 3.204 seconds, almost 300% slower than Fast mode. In my experience I’ve seen much worse performance with Verbose mode.
When I run the stats command in verbose mode, I do get to see the events data. See Figure 7.
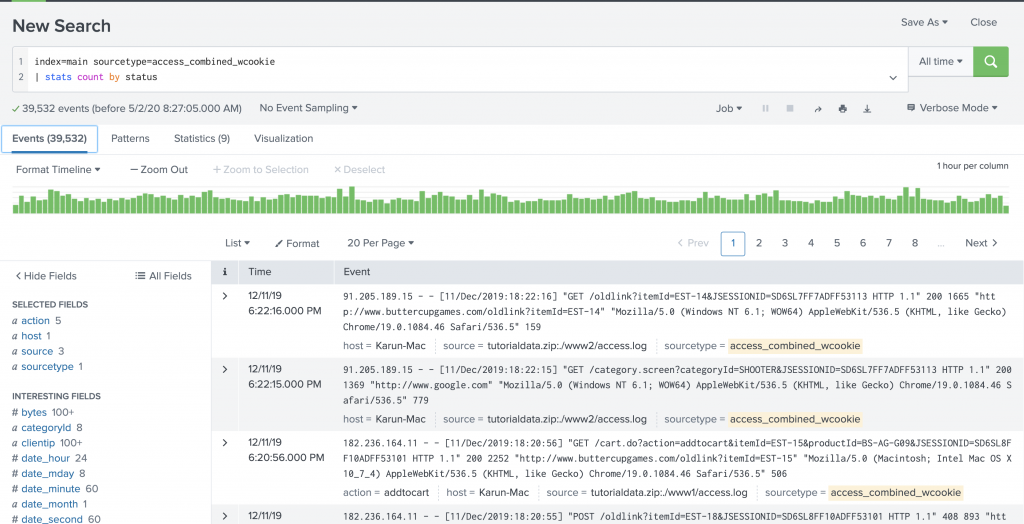
Figure 7: Events are loaded when you run a statistical command in verbose mode.
Now, let’s take a look at smart mode.
Smart Mode
Smart mode is a blend of Fast mode and Verbose mode, thereby gives the best outcome. In smart mode, automatic field discovery is enabled when you search for events. However, when you use a statistical command, event data is NOT loaded. Figure 8 shows the same search in smart mode.
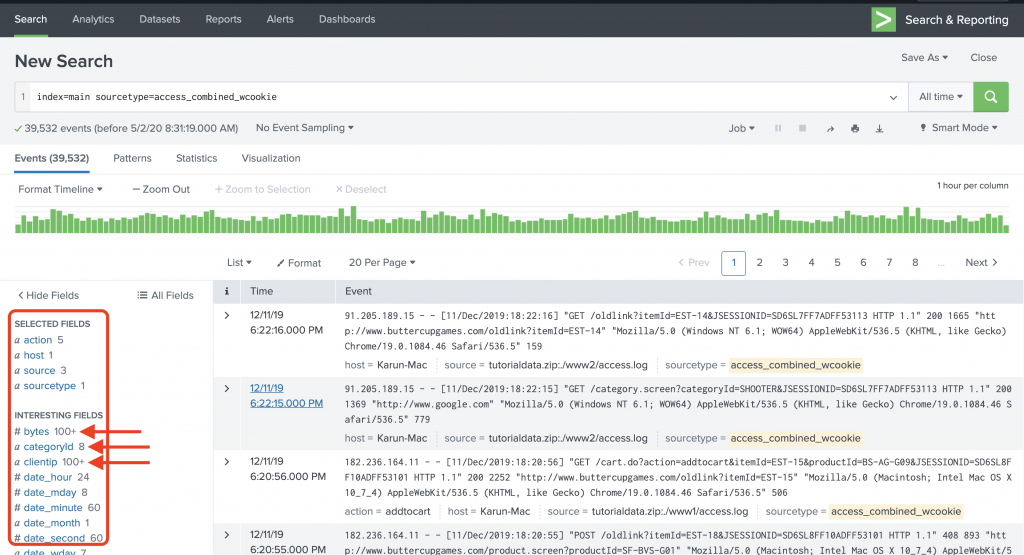
Figure 8: Smart mode search
The search took 3.104 seconds to finish. Not much gain in terms of performance in this scenario compared to verbose mode, but can be significant when the data is huge, and when you use statistical searches.
When I run the stats command in smart mode, I don’t get to see the Event data. See Figure 9. This search only took .417 seconds to run in smart mode, which took 2.659 seconds in verbose mode.
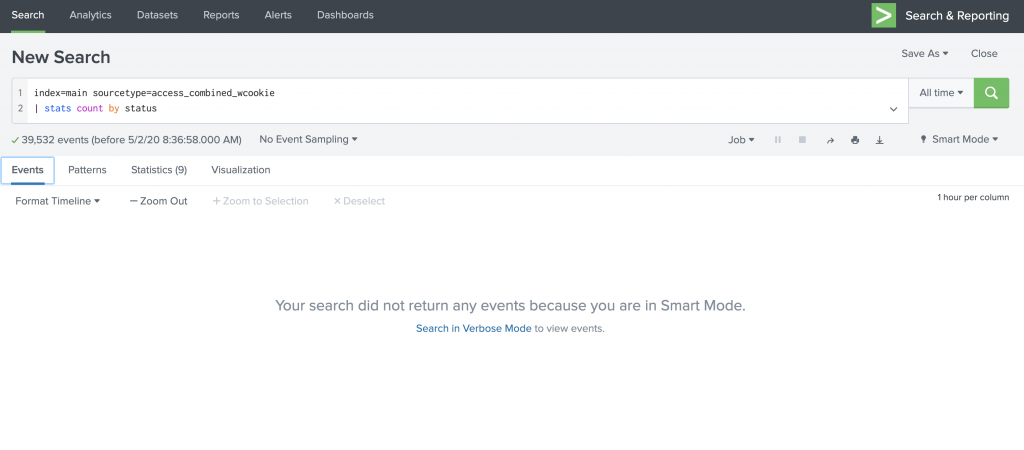
Figure 9: Smart mode does not load the events data for statistical searches
Important note: A saved search runs in the mode in which it was saved. So, if you see that your scheduled reports are running really slow and email deliveries are delayed, see if you saved them in verbose mode and explore the possibility of switching to fast or smart mode.
To sum this all up:
| Attribute | Fast Mode | Verbose Mode | Smart Mode |
| Speed | Fast | Slow | Balanced |
| Completeness | Poor | Full | Balanced |
| Field discovery | Off | On | On |
| Events available with stats? | No | Yes | No |
Hopefully now you understand what these search modes mean. To be on the safe side, I recommend using Smart mode first, and then switch to Fast or Verbose as needed. The default mode of Splunk is Smart mode.
Now, if you want to see a demo of what I explained, take a look at the video 1 below. Happy Splunking !
Great explanation with the screen shot and easily understandable,
This is the first blog that clearly depicts the difference between all 3 modes. with screenshots the understanding became much clearer. Thankyou.
Just like some one is teaching me one to one .. Long way to go in training others .. the best explanation I have ever seen
Great Explanation !!! Thank you so much
Hi:
My Splunk is Enterprise Version: 8.2.3.
In verbose mode, the Events count showed 2,xxx but It didn’t show detail events . Why?
The query is:
index=win* sourcetype=win* | stats count by index sourcetype
Thanks
Sincerely,
John
Are you looking in the “events” tab? Your SPL will take you to the “statistics” tab by default.