by Karun Subramanian
on December 8, 2018
Docker is changing – scratch that – Docker has changed the way applications are built, deployed and run. If you are completely new to Docker, I recommend reading my other post: What is Docker? An absolute beginner’s guide. There, in addition to explaining what Docker is, I walk you through how to create a docker container and run your application in it. In this post, let’s take a step further by creating a distributed service using Docker. In other words, let’s make Docker production-ready. You’ll learn the following
- What is docker-compose and how to create your first docker-compose.yml ?
- What is a docker swarm and how it provides a robust, scalable container platform ?
- How to create a docker swarm and deploy your application in it ?
- A working example along the way – end-to-end.
Sounds good ? Let’s jump.
Read More
by Karun Subramanian
on June 10, 2017
So we all know that Java Heap is a crucial resource, lack of which will kill your application. Naturally you will want to monitor the heap usage. Bur surprisingly it is not very straight forward to measure the heap usage of your JVM unless you have a modern APM (Application Performance Management) tool implemented. To make things worse, in Windows world, the memory you see in Windows Task Manager (a solid tool by btw) is NOT the same as the JVM heap size.
For example, let’s say you have set maximum java heap at 3GB. But it is quite possible that the memory shown by Task Manager be higher (much higher at times), say 3.5 gb or 4 gb. You can pull you hair trying to figure out where that extra memory utilization came from, or you can read rest of this article and put an end to the mystery.
Generally speaking, here is the reason memory shown by the Task Manager is more than the Heap: The memory shown in Task manager is the entire Memory footprint of the JVM and NOT just the Java Heap of the JVM. Note that the JVM is just an another process as far as Windows is concerned.
Read More
by Karun Subramanian
on January 2, 2017
So you have installed AppDynamics Controller, instrumented a simple Java Application and even viewed it from AppDynamics Controller UI. You have come a long way. Excellent work! In this blog post, I’ll take you a step further by showing you how to view critical Application Metrics in the UI. In order to get to see various monitoring metrics, let us use a more sophisticated application (one with a backend database).
Fortunately a sample application is available at github specifically for this purpose. Kudos to the developers who made this available to all of us. The application is based on Docker (no surprise there) so you need to have Docker installed in your server that you are planning to use as the Application host. If you don’t want to go this route, simply instrument one of your applications (preferably in Dev environment).
Here are the steps to install the docker based sample application.
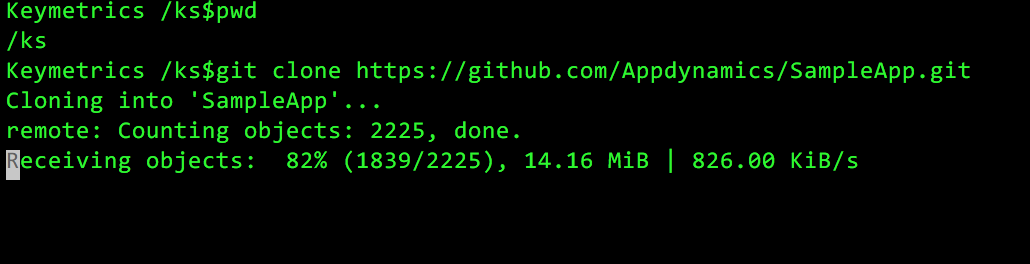
- Clone the git repo
git clone https://github.com/Appdynamics/SampleApp.git
Read More
by Karun Subramanian
on December 29, 2016
Now that you have your AppDynamics Controller up and humming, the next step is to instrument an Application to see the awesomeness of AppDynamics in practice.
For this blog post, I’ve chosen a very simple Java Web Application running on a tomcat server (It is the ‘sample’ application that comes with tomcat). The instrumentation process is fairly straight forward. While what I’m about to show is fairly manual, in real world scenarios involving hundreds of servers, you will be using some sort of automation 🙂
At high level, here is the procedure:
- Download the agent software either from the controller UI, or from appdynamics website
- Copy the agent software to the target application server (which is to be instrumented)
- Update the java command line that starts the application to instrument AppDynamics and restart the Application Server.
Ready ? Let’s get started.
Read More
by Karun Subramanian
on December 27, 2016
OK. So, you want to get AppDynamics controller installed on your Mac. Perhaps you want to test the awesome power of AppDynamics locally before purchasing the product. Great. In this blog post, I’m going to show you how to get AppDynamics Controller installed on your Mac. Let’s get to work.
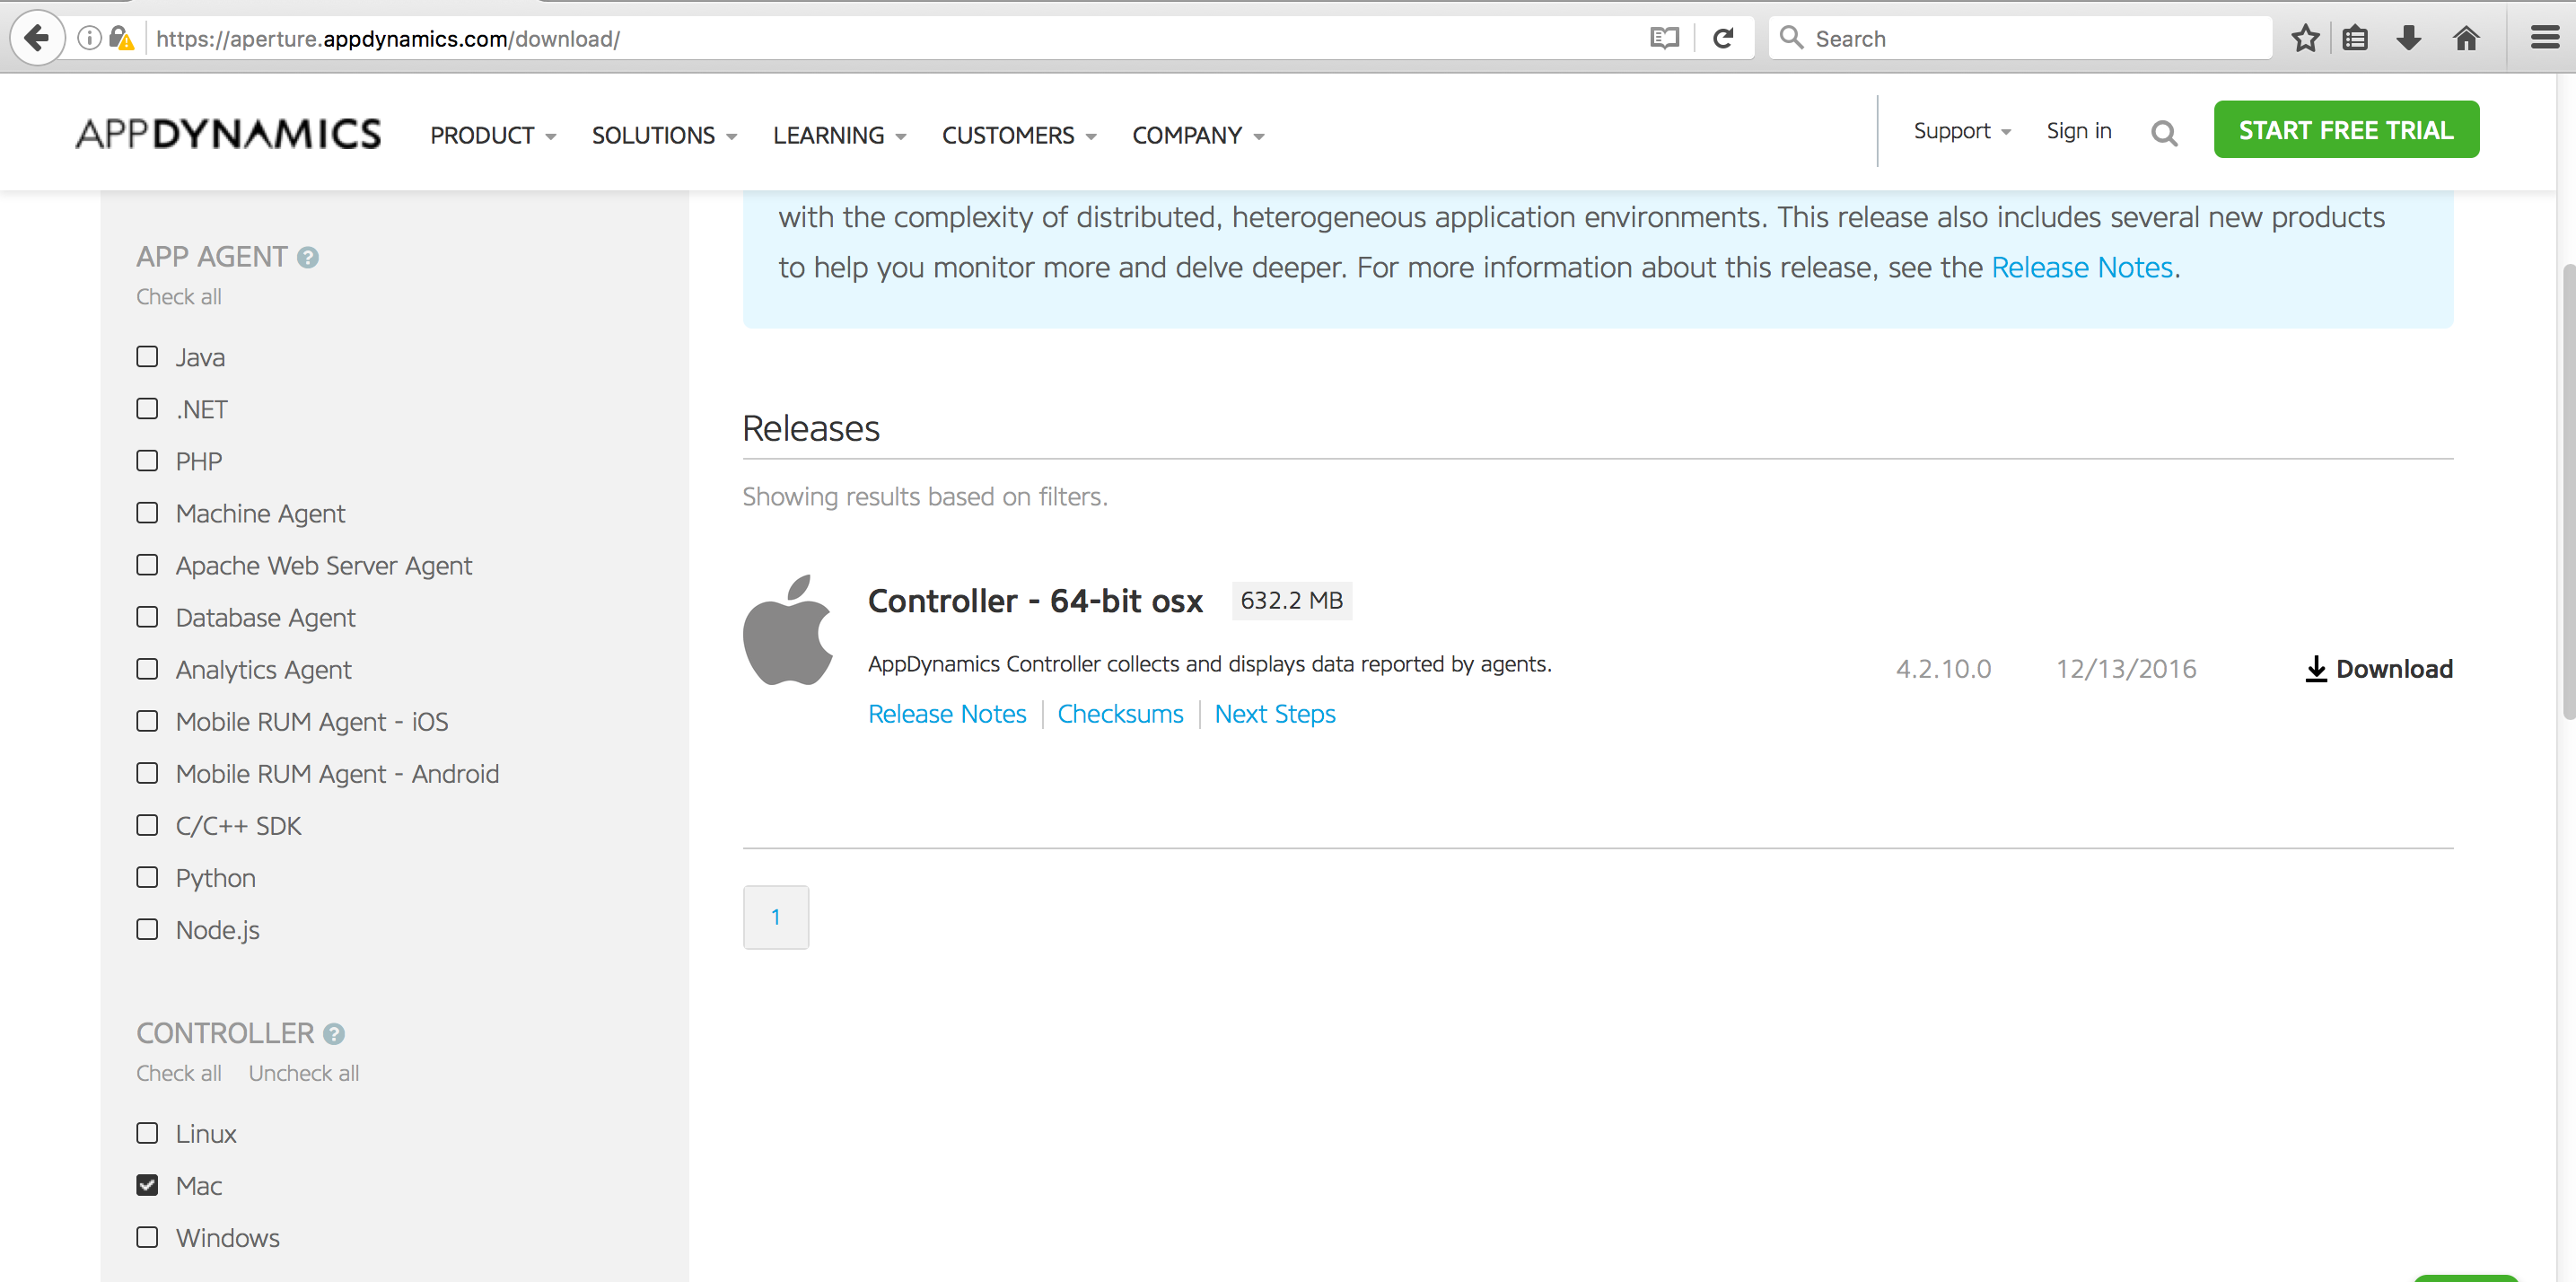
- Login to https://aperture.appdynamics.com/download/
- Scroll down on the left pane and select the Mac check box
Read More
by Karun Subramanian
on December 25, 2016
When working with shells, if your Mac does not show various colors automatically, you can enable them by two easy steps.
First add a line as shown below to your .bash_profile. This file should be under your home directory.
export CLICOLOR=1
Second, add the following line in your .vimrc file. This file should be under your home directory. If it is not there, create one.
Read More
by Karun Subramanian
on July 30, 2016