by Karun Subramanian
on May 29, 2017
Java 9 is supposed to be released in summer 2017. The biggest changes appear to be around modularization which enables you to create, build, deploy and reuse modules of code. There is also the new jshell command line tool that lets you test snippets of code quickly. From Application support standpoint, I see one major change in memory management and that’s what I want to discuss today.
GC (Garbage Collection) is the bread and butter of Memory Management in java. GC is responsible for cleaning up dead objects from memory and reclaiming that space. GC executes its cleanup using predefined Collectors that use certain algorithm(s). As I mentioned in my previous post, there are 4 Collectors that can be used.
- Serial Collector
- Parallel Collector
- CMS (concurrent Mark and Sweep) Collector
- G1 Collector
Until Java 1.8, on Server class machines (2 CPU and 2GB RAM minimum. Humor me if your server is leaner than this size), the default collector is Parallel collector.
Parallel collector is all about throughput. It does not care about having longer GC pause times (as it will stop the application threads before performing a GC). If you cannot tolerate long GC pause times (upwards of 1 second), you could choose CMS collector.
G1GC was introduced in Java 1.7 to address both increased throughput and decreased GC pause times overall.
Here is the major change with this edition of Java. G1GC is the default collector in Java 9.
Read More
by Karun Subramanian
on May 25, 2017
In this post, I’m going to explain how Heap is organized using generations and how Garbage Collection works behind the scene to free up memory. Java memory management has evolved a lot over the past few java releases. Understanding the mechanics underneath will help you better tune it (if required) to suit your needs.
When your java application runs, it creates objects which takes up memory space. As long the object is being used (i.e referred by the application somewhere), it is going to occupy the memory. When the object is no longer used (for example, when you cleanly close a DB connection), the space occupied by the object can be reclaimed by Garbage collection.
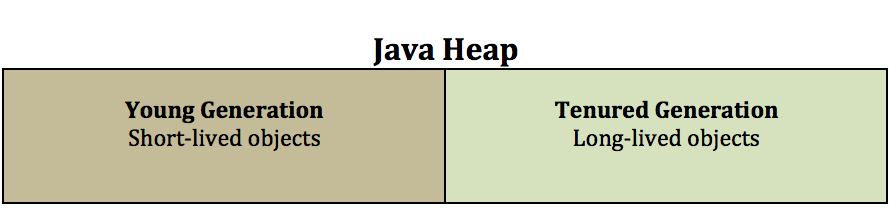
What are generations ?
Java heap is typically divided into two major pools. An area where short-lived objects live. And an area where long-lived objects live. Young generation (aka Nursery aka Eden) is the place for short-lived objects and Tenured generation (aka Old) is the place for long-lived objects.
Why Generations ?
Read More
by Karun Subramanian
on May 22, 2017
Heap is the memory space where java application objects are stored. Unfortunately the size of Heap is limited (by the -Xmx java command line option). When all of heap is used up, you are in deep trouble. So, it helps to understand how to measure Java heap usage, and that’s exactly what I’m going to be discussing with you in this post.
Very surprisingly, measuring heap is not that straight forward in java world. I believe it is due to the fact there are numerous ways to measure java heap. Oracle seems to introduce new tools with every release (and retire the old ones). For this reason, I recommend everyone to invest in a commercial grade APM (Application Performance Management) tool. With APM tool, you will simply login to the APM interface (typically a web application) to view the JVM heap usage (along with tons of other useful metrics)
Using the command jcmd to measure heap usage
Java comes with a command line tool named jcmd. It should be available in most flavors of Java (Oracle, IBM etc). I’m going to recommend jcmd to measure your heap usage. One of the advantages of using jcmd is the class histogram which not only shows the heap usage but it breaks down the usage by class. This gives you an instant view of what is causing heap to fill up.
Important Note: jcmd does have some impact on the jvm. But I assure it is worth the price, as the details shown by jcmd are very valuable.
Important Note: the command jcmd must be run as the same user (or effective user) as the user running the java application
Let us see jcmd in action.
Read More
by Karun Subramanian
on May 21, 2017
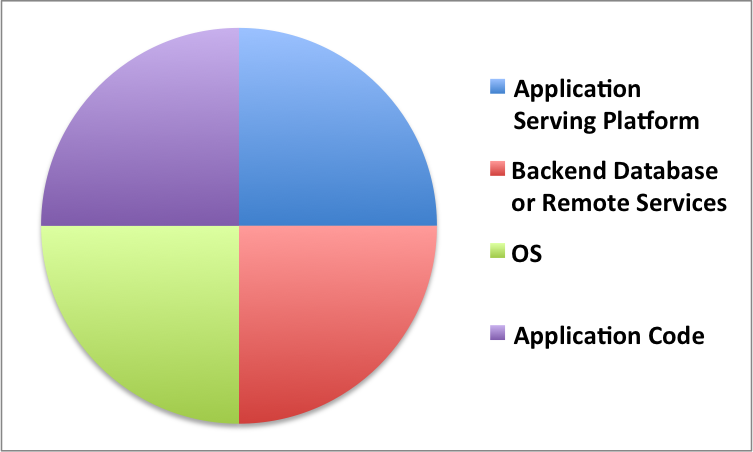
As an Application Support Engineer or a Lead Developer, you are supposed to save the day when things hit the fan. But this is easier said than done. I’ve dealt with these issues on a daily basis for couple of decades. In any enterprise application, there are 4 major subsystems that cause performance degradation or outage. Even though the Application platforms have drastically changed in the past few years, these 4 subsystems still make up majority (if not all) of the issues. Understanding this obvious, yet often overlooked fact, you will be able to ask intelligent questions during troubleshooting.
Without further due, here are those:
- Application Serving Platform (typically an Application Server or PAAS)
- Backend Database or other Remote service(s) that your application depends on
- The Operating System that hosts the Application
- Application Code
And no, Network is NOT one of the major subsystems to point finger at. That is not to say that Network issues do not occur at all. But in practice, I would look at Network when all other suspects have been eliminated.
Also note that the 4 subsystems listed are not in any order. That is, they all have equal chances of being the culprit.
Image: 4 Subsystems responsible for Application stability
(C) Karun Subramanian
Read More