Yes, AppDynamics is awesome for Application monitoring – Java Heap, deep transaction tracing, tons of out-of-the-box framework monitoring (JDBC,WebService etc) and the list goes on. But do you know Appdynamics can be used to effectively monitor Servers too, whether it is virtual or physical? When I say server, I mean the host operating system such as RedHat Enterprise Linux, Windows 2012, Solaris etc. Let me show you how you can do this.
Enter AppDynamics Machine Agent
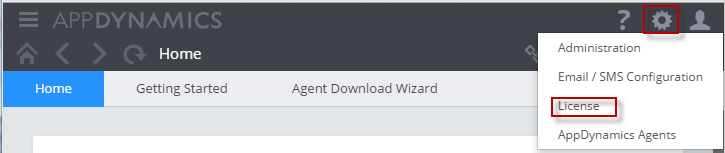
While Java can be monitored using a Java Agent, a Server can be monitored using a special type of agent called Machine Agent. You will have to have license to run these agents (When you purchase Application agents, typically AppDyanmics throws the same number of Machine Agents, and so you should be good in terms of additional cost). If you are not sure about your present licensing situation, click on ‘licensing’ in your Controller UI as shown below.
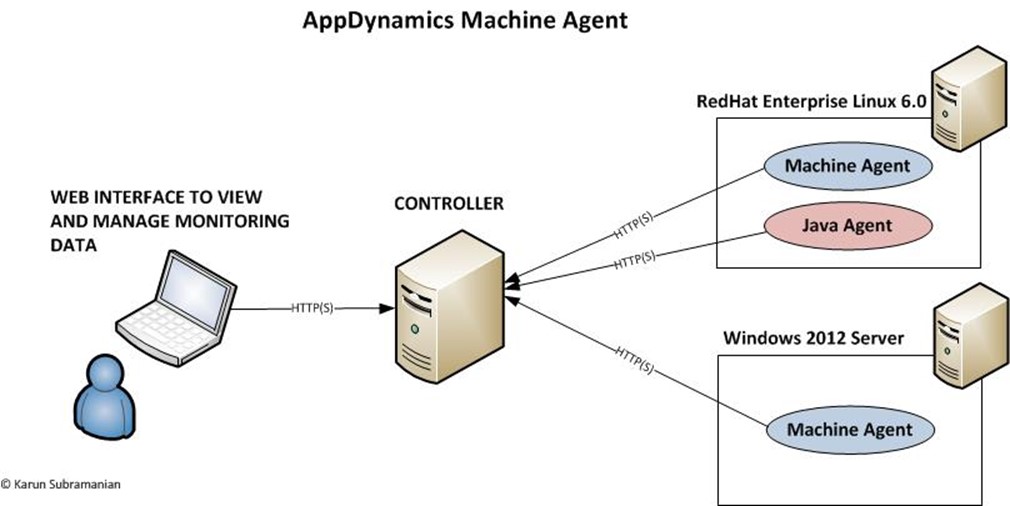
Unlike Application agents which run inside the JVM/CLR, Machine agent is a standalone Java program that runs on the host operating system. It collects hardware metrics and sends them to Controller (once a minute). A user can view these metrics via Controller UI. Pretty simple, hah?
One of the coolest and most robust features of Machine agents is the extensions (aka monitors). Machine agent has extensible architecture, meaning you can write your own custom monitoring extensions, or use one of 100+ community developed extensions. Extensions let you monitor virtually anything. More on that later.
Where can I see Hardware Metrics in the Controller UI?
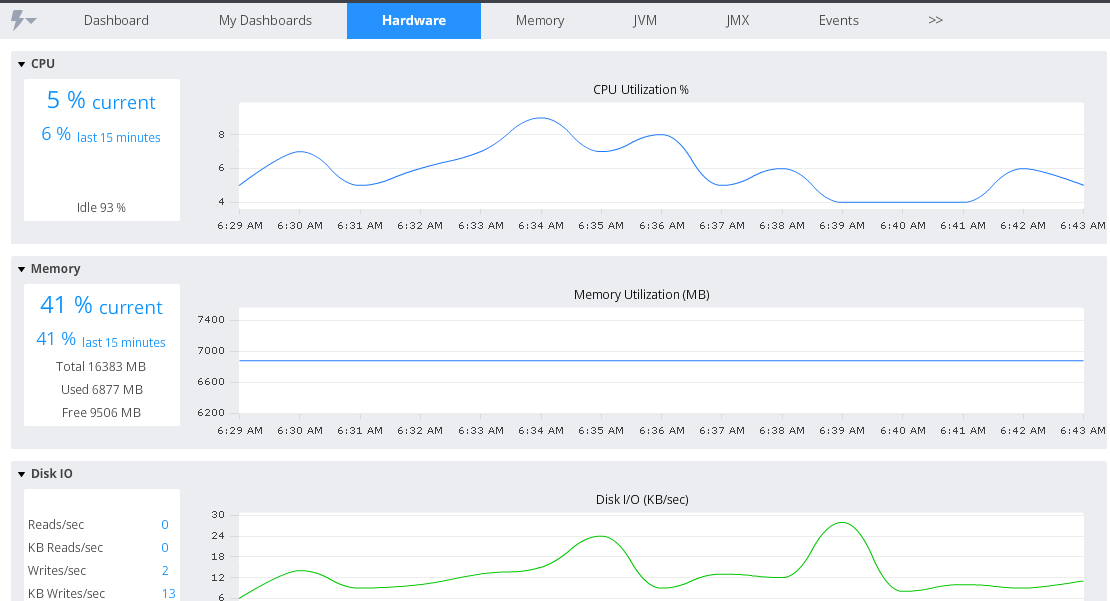
In Dashboard, you can see them under ‘Hardware’ tab of a Server. The dashboard shows only the critical metrics such as CPU and Memory. To view all the metrics available, you need to use the Metric browser and navigate to ‘Application Infrastructure Performance’ -> <Server> -> <Node>
So, what exactly does the Machine agent monitor?
A lot.
The following table summarizes useful out-of-the-box Metrics that are collected by Machine agent (in most operating systems).
| Metric | Description |
| CPU Metrics | |
| % Busy | Percentage of time CPU was processing requests. 100% means you have run out of processing power |
| % Idle | Percentage of time CPU was idle 0% means you have run out processing power |
| % Stolen | Percentage of time the OS cannot categorize the CPU usage (such as user,system). You are likely to see come CPU cycles stolen by the Hypervisor (Example: VMWare ESXi) in a virtual machine. |
| Memory Metrics | |
| % Free | Memory (RAM) available for processes |
| % Used | Memory (RAM) currently being used |
| Disk Metrics | |
| Space available | For each drive/File system, space available |
| KB read/Sec | Kilo bytes read per sec |
| KB write/Sec | Kilo bytes written per sec |
| Reads/sec | Number of read operations per second |
| Writes/sec | Number of write operations per second |
| Avg Service time | Average disk service time (can be useful to determine disk latency) |
| Network Metrics | |
| Incoming KB/Sec | Kilo bytes coming in per second |
| Outgoing KB/Sec | Kilo bytes going out per second |
| Incoming Errors | Errors per second (inbound) |
| Outgoing Errors | Errors per second (outbound) |
Note:
When viewing a metric in metric browser, you can hover over the graph (around a data point) to view detailed information about the metric.
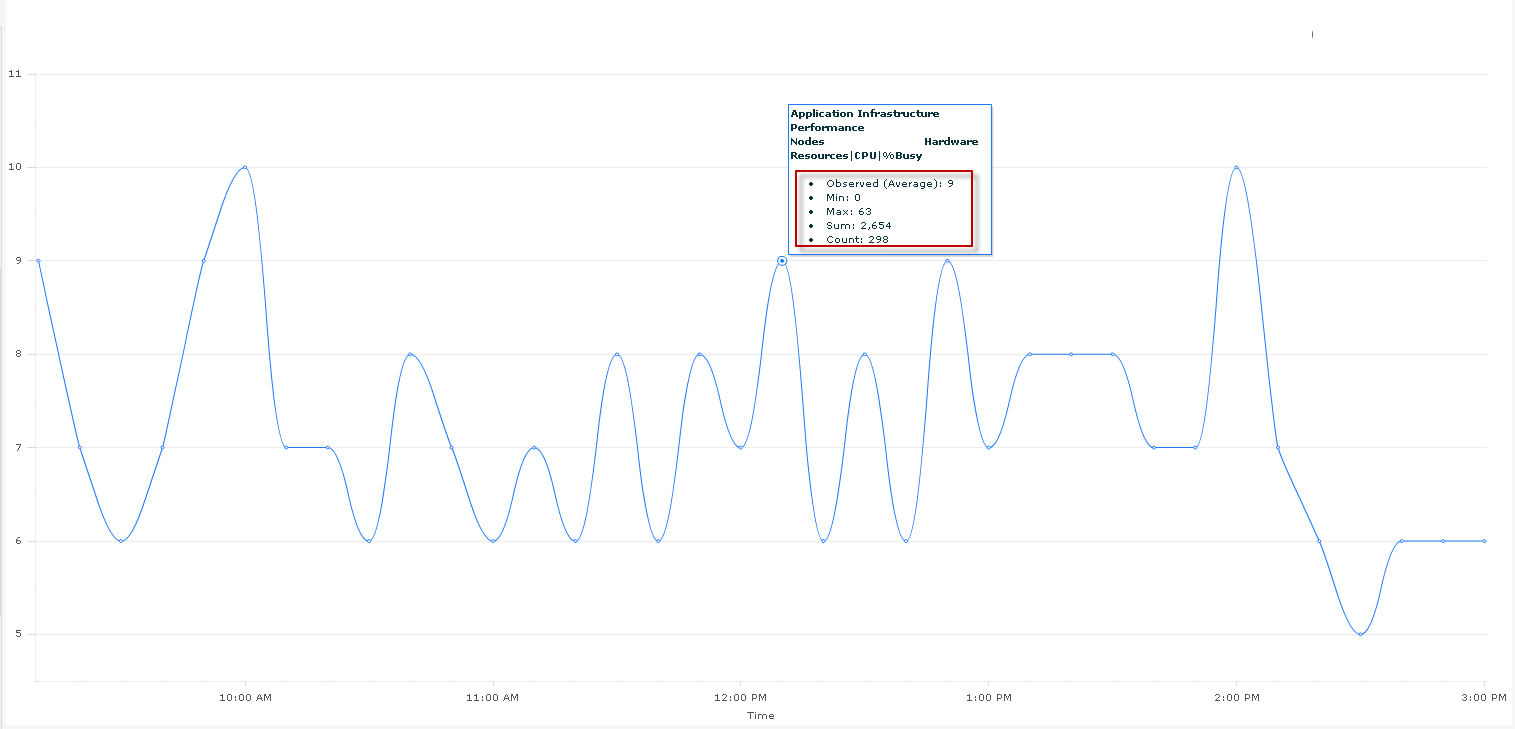
Here is the explanation for those values:
Observed: The average of all data points in the interval between two data points
Min: Minium value seen during the interval
Max: Maximum value seen during the interval
Sum: Sum of all data points seen during the interval
Count: Number of observations aggregated in that datapoint
Great going folks. Go ahead and put your newly learned information to work and configure some bada*s server monitoring using Appdynamics.
Comments on this entry are closed.