Troubleshooting JVM memory issues can be daunting, but you if you don’t fix it, it can kill your application and possibly your face in front of your customers. There is good news though. With any modern APM tool, you virtually get an X-Ray vision to this labyrinth named Java Heap.
In this blog post, I’ll show you how to use AppDynamics to troubleshoot Java memory issues.
AppDynamics is one of the leading APM vendors in the market, providing tons of useful tools ranging from Hardware monitoring to End user experience monitoring to operational data analytics (Actually it can be quite overwhelming. If you don’t know what exactly you are looking for in the tool, you can go in circles. But don’t worry, I can help).
There are three major areas where AppDynamics can help in regards to Java memory troubleshooting.
- Record and show metrics related to Java Heap Utilization, Garbage Collection and Memory Pools
- On-Demand memory leak detection (big one)
- Track object instances (almost like a micro heap dump analysis)
Record and show metrics related to Java Heap Utilization
When you instrument your JVM with Appdyanmics agent, the memory metrics are automatically captured. In the Appdynamics Controller UI (which is your primary interface for visualizing the captured monitoring metrics), navigate to your Node where Java agent is running. Then click on the Memory tab.
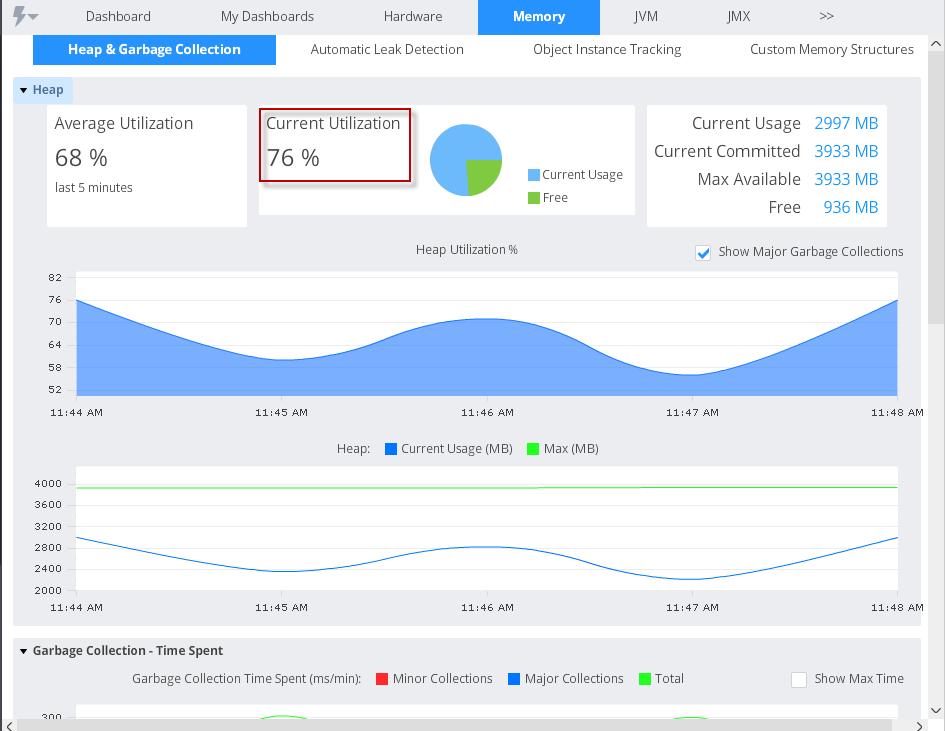
See that? Let us look at these graphs individually.
The top portion of this Dashboard shows the following:
- Average Utilization: Shows the percentage heap utilization in the past ‘n’ minutes. (n is defined by the drop down time range picker at the top right)
- Current Utilization Pie Chart: Shows the current heap utilization percentage. Anything about 85 over longer period of time could be a problem.
- Values for current usage, current committed, max available and free Heap.
Current usage is how much memory is actively being used by the application
Current committed is how much memory is reserved for the jvm (no other process can claim this memory)
Max available – This defined through the –Xmx parameter of the java command line that starts the application
Free shows free memory available
Heap Utilization (%) graph
Shows the heap utilization (%) in a graph. Obviously you don’t want anything above 85% for longer period of time.
A health JVM has a saw tooth pattern. I.e the memory utilization gradually goes up and GC reclaims space from unused objects. If you see upward sloping saw tooth, your application is probably having memory leak.
When you select the check box Show Major Garbage Collections the graph shows green garbage can icon when a major gc occurs.
Heap (current usage and Max) in MB
Shows the Heap utilization and Max Heap in MB.
Garbage Collection – Time Spent
Very important graph. It shows the GC time. If you are seeing Major GCs taking more than 3 seconds. You need to dig further. I’m being conservative here. Even 3 seconds can be a big no-no for certain Applications (example: Stock exchange). When this goes up to several seconds, users will see your application unresponsive. Remember, the entire JVM is paused when major GC happens and it can be havoc for user experience.
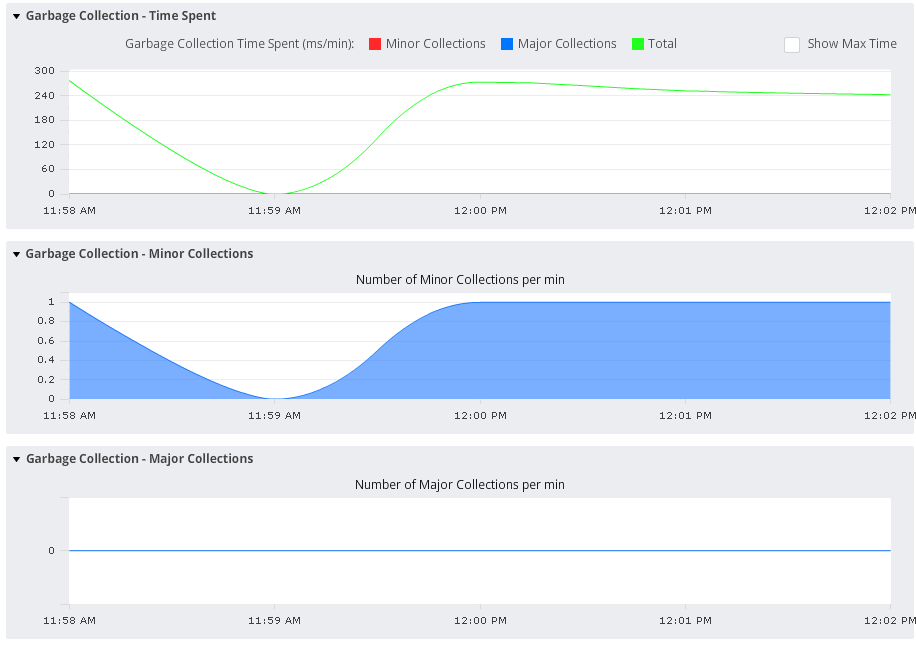
Garbage Collection – Minor collections
Shows the number of Minor Garbage collections
Garbage Collection – Major collections
Shows the number of Major Garbage collections
Memory Pools
This is where a tool like AppDynamics can be helpful. With verbose GC logs, it is going to be quite hard to analyze all these various pools. AppDynamics compiles the data and shows them in intuitive graphs.
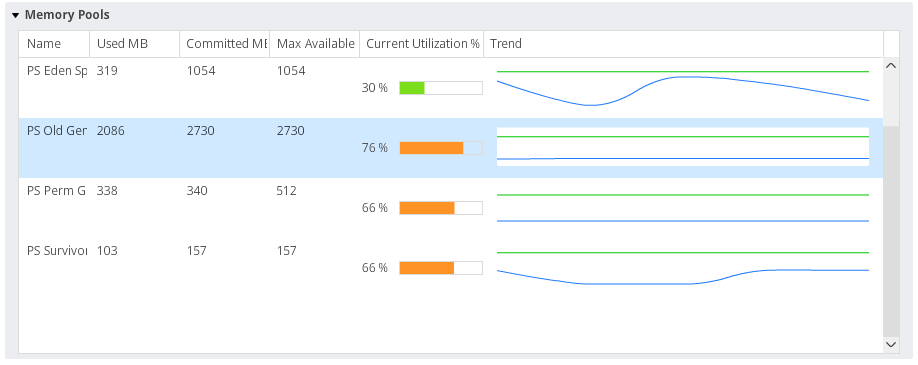
This information can be game changer. For example, you might find that you are running out of Permanent generation space (can be indicative of third party libraries that use tons of class objects or interned strings).
Oh btw, in any graph, you can simply double click to open it in Metrics browser window (Some users prefer Metrics browser window)
Great going! You’ve learned lots of good stuff here. Let’s keep going. In part 2, I’ll show you how you can use AppDynamics to hunt down memory leaks.
Happy Monitoring !!
Comments on this entry are closed.