Java 9 is supposed to be released in summer 2017. The biggest changes appear to be around modularization which enables you to create, build, deploy and reuse modules of code. There is also the new jshell command line tool that lets you test snippets of code quickly. From Application support standpoint, I see one major change in memory management and that’s what I want to discuss today.
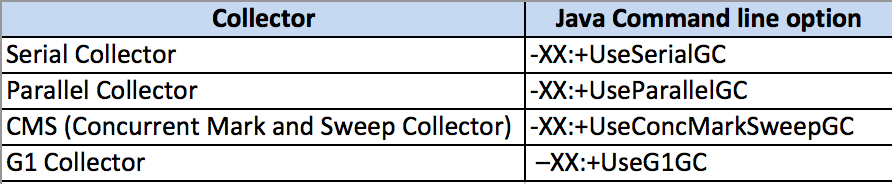
GC (Garbage Collection) is the bread and butter of Memory Management in java. GC is responsible for cleaning up dead objects from memory and reclaiming that space. GC executes its cleanup using predefined Collectors that use certain algorithm(s). As I mentioned in my previous post, there are 4 Collectors that can be used.
- Serial Collector
- Parallel Collector
- CMS (concurrent Mark and Sweep) Collector
- G1 Collector
Until Java 1.8, on Server class machines (2 CPU and 2GB RAM minimum. Humor me if your server is leaner than this size), the default collector is Parallel collector.
Parallel collector is all about throughput. It does not care about having longer GC pause times (as it will stop the application threads before performing a GC). If you cannot tolerate long GC pause times (upwards of 1 second), you could choose CMS collector.
G1GC was introduced in Java 1.7 to address both increased throughput and decreased GC pause times overall.
Here is the major change with this edition of Java. G1GC is the default collector in Java 9.
With G1 Garbage collector, the entire heap is divided in to fixed-size regions. These regions are then grouped as various generations (Young, Tenured, Survivor etc). Note that these regions are contiguous blocks of memory. During the ‘mark’ phase of the GC (Mark phase is when GC identifies all the objects that are alive), the entire Heap is analyzed. G1 collector applies the ‘sweep’ phase to the regions that are most likely to free up large amount of memory first.
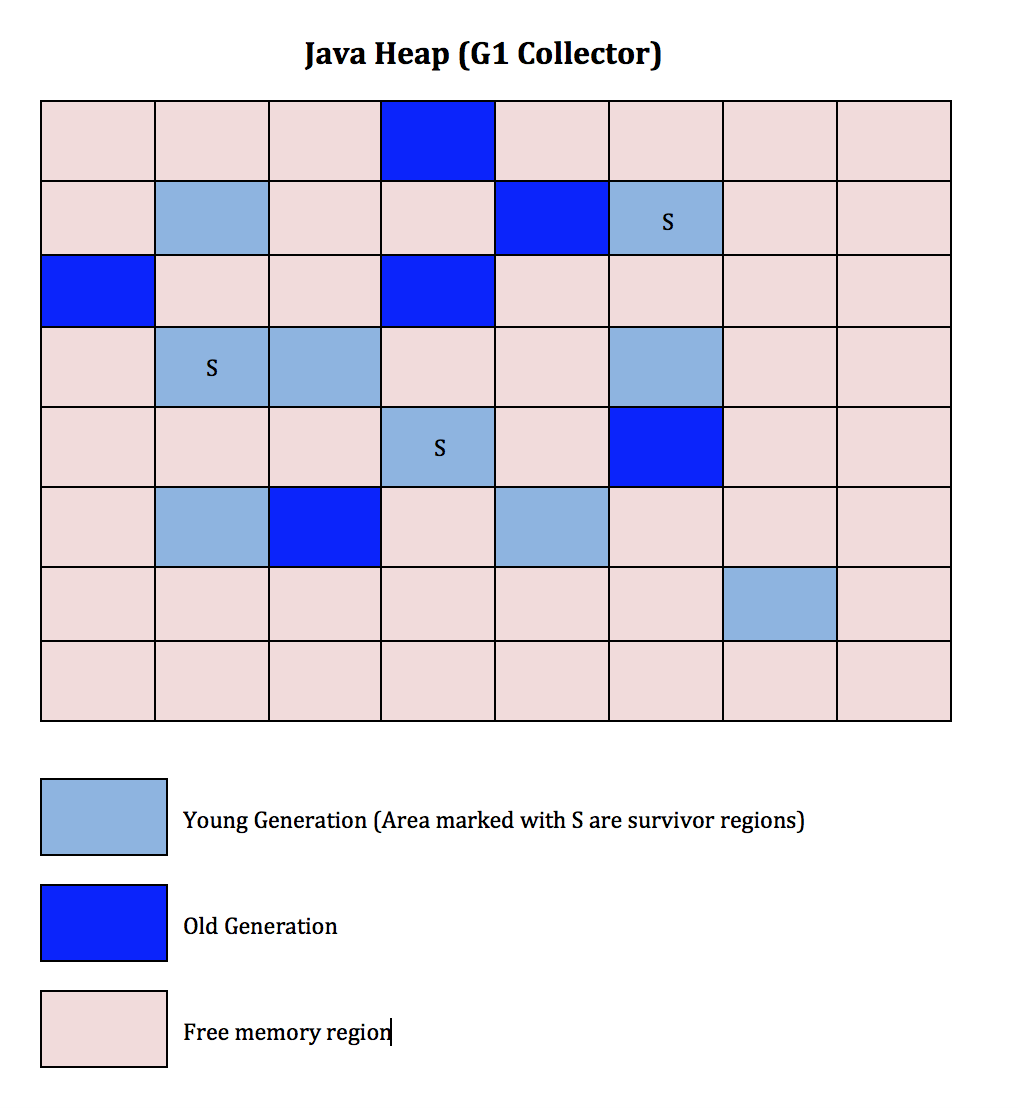
G1 Collector compacts the heap throughout the GC operation (it does this by copying objects from several regions into to a single empty region). With the throughput collector (Parallel collector), compaction happens only for the whole-heap operation which results in considerable GC pause time.
Why you need to know this?
In most cases, this change to the default GC will be unnoticed. However, after upgrading to Java 1.9, if you see any performance issues, revert back to old GC collector and see if that’s the culprit. Here are the command line options for the GC collectors
Best troubleshooting tool to diagnose GC/Memory related issues is verbose gc logs. Crank up the verbose gc logging and monitor it over a period of time (a day or two).
Couple of other useful articles for you:
Troubleshooting GC: Using Verbose GC logs
One important change in Memory Management in Java 8
5 not so easy ways to monitor the Heap Usage of your Java Application
Good luck.
Java 9 incorporates design and implementation a standard module system for the Java SE Platform and applies that system to the Platform . Many thanks for sharing.
LOVE this article (and your others!). Wonderful points you have mentioned here. its actually a great and helpful piece of information. I am satisfied that you simply shared this helpful info with us. Thank you for sharing