So, when was the last time you monitored the CPU utilized by your Java application ? Perhaps ‘never’ ?. It is actually important to keep an eye on the CPU utilzied by your application. Your Application runs on a host (or hosts) that has one or more CPUs managed by the Operating System. The CPU resource is not unlimited (even though some developers and Administrators wish that were true).
Let’s dive into the 4 things you need to know about the CPU Utilization of your Java application.
1. Why do you care ?
The CPU cycles are shared among all the processes running on the host. When there is no cpu cycles left, things start to queue up and you see ‘slowness’ in your Application. It is possible that your application is the one that consumes the most CPU. Or it could be some other process that is taking up all the CPU, but your application will be affected regardless because all the processes on the host share the same CPU resources.
Based on my experience, your application should take no more than 30% of the CPU, if it is the only ‘major’ application on the host. This is to make sure you have some head room in case of sudden spike in the Load. When you notice higher CPU usage, it can mean underlying issues with the code and/or the environment.
Top reasons for higher CPU Utilization:
a. There are excessive GC cycles going on
b. Too many Application threads active
c. Code problems such as ‘infinite loops’ or excessive backend calls.
d. The application is indeed working hard and the host does not have enough CPU (this is actually a good reason)
2. How do I measure the CPU utilization of my Java Application ?
Your application is nothing more than a ‘process’ as far as the operating System is concerned. This means you can rely on Operating System tools to find out the CPU utilized by your application.
It is important to note that you must be able to identify your Application process in order to see the CPU utilized by your application. To do this:
Unix/Linux:
Use ‘ps -ef | grep <a string that can identify your application.>’. For example, ‘ ps -ef | grep java’.
You can use couple of commands to check the CPU utilization in Unix/Linux world
a. Using the command ‘top’
‘top’ is a very powerful tool to show the process level statistics including CPU usage.
b. Using the command ‘ps -eo pid,pcpu,args | grep <a string that can identify your application>’
The second column in the output of the above command shows the percentage CPU used.
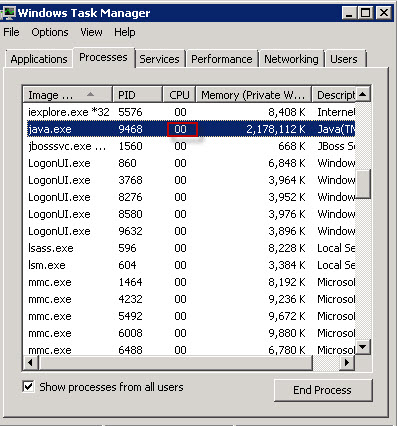
Windows:
Use ‘Task Manager’ to view the CPU Utilized by your application process.
Note about Clusters:
If you have more than one instance of your application running on the same host (Vertical cluster), you must add the CPU utilized by all the instances to find out the net CPU Utilization of your application.
Other tools:
You can use VisualVM or Jconsole to monitor CPU utilized by your application.
Image from docs.oracle.com
APM (Application Performance tools) can be of great help here. They not only monitor the CPU usage, they can create alerts based on a preset threshold or automatically learned threshold. They can also store the metrics for historical analysis.
3. The sweet spot
So, it is really bad if your application consumes lot of CPU ? Not necessarily. It is possible that your application indeed needs more CPU because of the type of processing it does. When the only bottleneck is the CPU resource for your application, you have achieved the sweet spot. This means you can increase the throughput just by increasing the amount of CPU (either by adding more CPUs to the same host or by adding a new cluster member)
Also note that some operating systems allow you to setup a quota for CPU utilization. For example you can assign maximum of 40% CPU to certain process. This will help to avoid bringing down the entire server due to a bad application. Check with your Systems Administrator if such quota has been setup.
4. Effect of Number of threads
More number of active threads within the application, heavier the CPU usage will be. There will be numerous context switches because of excessive number of threads. In fact the role of Thread Pool is to limit the number threads from going over a limit. Excessive number of threads can indicate a code issue or a poorly responding backend.
You can take a thread dump to review the threads inside the JVM.
Use ‘kill -3 < PID >’ in Unix/Linux to generate Thread dump. Use ‘jstack’ command in Windows to generate the thread dump.
There you have it. 4 things you need to know about CPU utilization of your java application. Get into the habit of periodically monitoring the CPU utilized by your application. Excessive CPU utilization can indicate an underlying code issue. It can also affect other applications running on the same host. The best way to monitor CPU utilization is to invest in a good quality APM (Application Performance Management) tool. The best way to defend CPU usage issues is to thoroughly load test your application in lower environments and resolve issues before deploying to Production.
Good luck.
Could you send answer for below questions.
1. Consider a situation where you’re seeing that application response time has degraded, when compared to your last successful test :
a. What do you think could’ve contributed to this ? (list all probable causes you may think of)
b. How’d you diagnose this ?
2. How’d you diagnose a situation where you’re seeing increased CPU utilization on one of the App layers ?
1. Consider a situation where you’re seeing that application response time has degraded, when compared to your last successful test :
a. What do you think could’ve contributed to this ? (list all probable causes you may think of)
A. If you have any APM (Application Performance Management) tools implemented, review its dashboards/metrics to see which
subsystem is possibly causing the slowness. For instance, your APM tool might reveal backend DB response times are longer.
Examples of APM tools are NewRelic, Dynatrace, CA APM, AppDynamics.
B. Check OS system metrics (CPU and Memory) to see if your host is running out of resources. For example if the host (server)
is running at 100% CPU utilization, you are sure to see your application impacted
C. Review the Application Server log for any errors/exceptions. A log aggregation tool like Splunk can be very useful.
For example, is application throwing more than usual exceptions?
D. Finally, if you don’t have the tools to monitor the above mentioned metrics, you could take a thread dump of the
Application process and see what the application is doing. For example, you may find it’s waiting on response from
a remote web service call. More about taking thread dumps can be found at http://karunsubramanian.com/websphere/troubleshooting-using-java-thread-dumps-part-1/
b. How’d you diagnose this ?
Without monitoring tools already implemented, it will be somewhat difficult (but not insurmountable).
Without APM or Log aggregation tools, you are left with the following options.
A. Review your application log files (increase verbosity if needed)
B. Use OS commands/tools to monitor System and Application.
2. How’d you diagnose a situation where you’re seeing increased CPU utilization on one of the App layers ?
Excessive CPU utilization occurs due to one of the reasons below.
A. Your application has spawned excessive threads. And this could be due to a slow remote web service that your Application
relies on. A thread dump can reveal what’s going on.
B. There is too much load on your application i.e the number of incoming requests have suddenly increased.
C. There is excessive I/O going on. For instance, if you enable debug logging and you end up writing tons and tons of
data to disk, that might to start to show in CPU utilization.
Good luck.
Very interesting introduction. Thank you.