By default, AppDynamics captures tons of useful metrics from your java application. Average response time of your Applications, JDBC response times, Throughput, Heap and Garbage Collection Metrics etc. In addition, AppDynamics automatically captures Transaction Snapshots (that provide deep diagnostics) periodically and during slow response times. The snapshots will reveal the hotspots up to the method level.
But at times, you may want to monitor a particular method for performance metrics. For example, you may want to know how often a method named ‘cancelOrder’ is called and how long it takes to process. For requirements like this, AppDynamics provides a neat way of instrumenting your java method – Information Points.
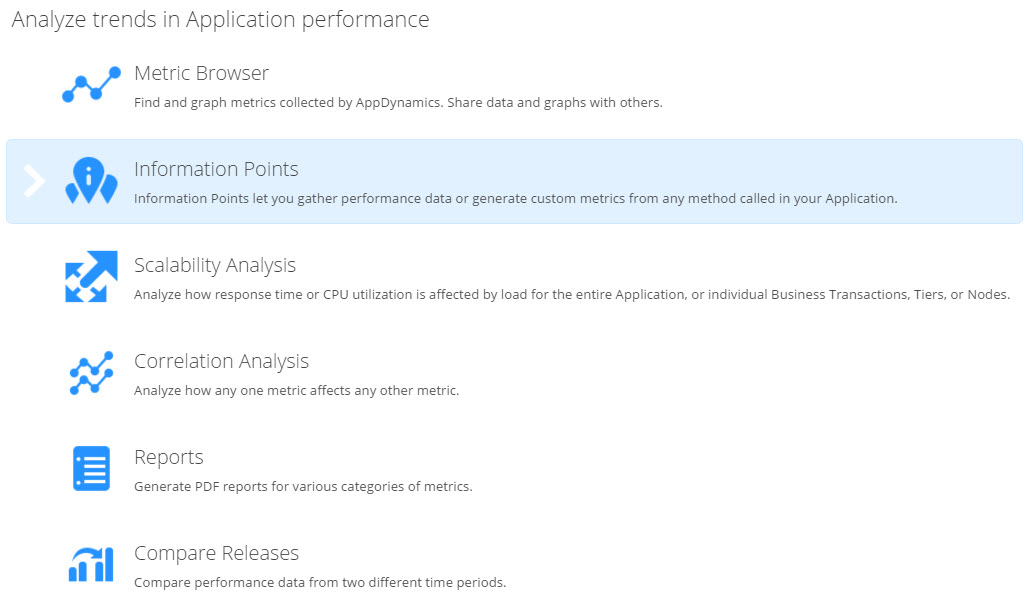
To configure a new Information Point, navigate to Analyze -> Information Points. Click on the New button at the top.
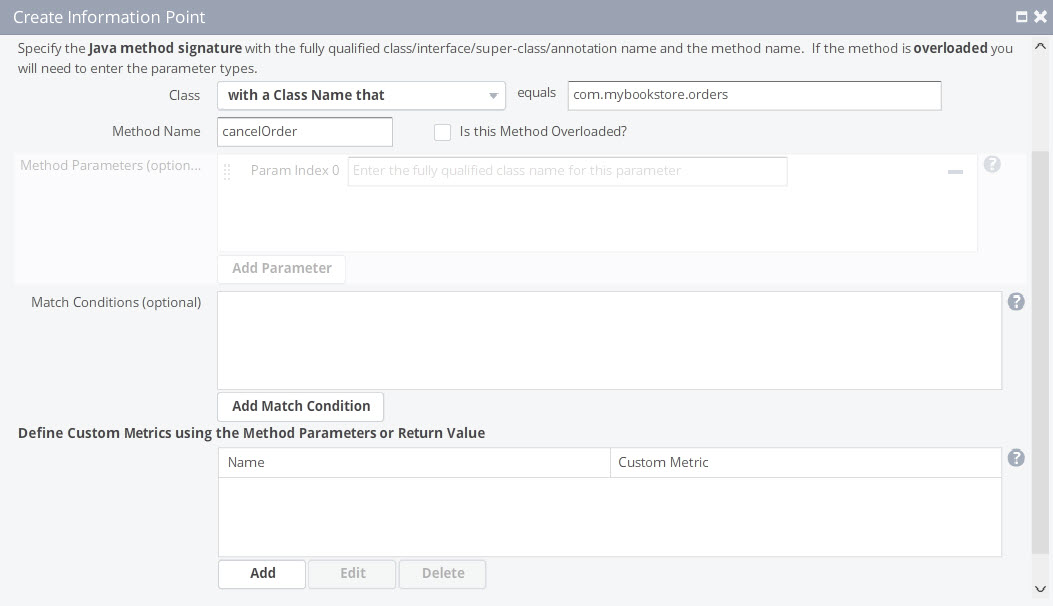 Provide a name for the Information point, specify the class name (fully qualified) and the method name and click Add. Note that you can even create custom metrics based on the method arguments or return values.
Once the information point is configured, performance metrics will be captured on the method instrumented.
Important Note: AppDynamics will start capturing performance metrics ONLY after the method is called. So, you may have to be patient until the method shows up (depending on how frequently the method is accessed).
By default, the following metrics will be captured for each Information Point.
- Response Time(ms)
- Calls
- Calls/min
- Errors
- Errors/min
- Errors %
- Number of Custom Metrics
Enjoy your newly found Data !!
Hi Karunsubrmanian,
Thanks for your data .
Can you share any way we can automate the java agent installation process….