One of the built-in tools that can be used to view the memory usage graphically is jconsole. It comes with JDK. Jconsole uses JMX (Java Management Extension) to pull several vital stats from the running Java application. While jconsole may seem little outdated (and it is) it is still valuable if you want a quick GUI to view JVM stats
How to invoke Jconsole ?
Jconsole is in <JDKHOME>/bin
In windows, you just type ‘jconsole’ to bring up Jconsole GUI (provided you have the PATH environment variable updated to include <JDKHOME>/bin
Note: If you are in an Unix environment, you may have to export the DISPLAY to point to your PC to invoke GUI
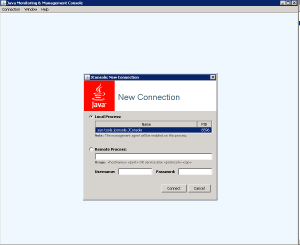
The opening screen shows the available java processes that jconsole can monitor. If you don’t see your application in the list, you are NOT running jconsole as the user that is running your application. If this is the case, you can try enabling JMX for remote management as follows:
Very critical Note: Use the options below ONLY in development environment as it opens serious loop holes.
Add the following command line options to the java command line of your application and restart the application:
-Dcom.sun.management.jmxremote.port=<portNum>. For example,
-Dcom.sun.management.jmxremote.port=9017
-Dcom.sun.management.jmxremote.authenticate=false
-Dcom.sun.management.jmxremote.ssl=false
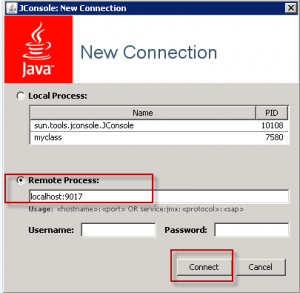
Once the application is started, invoke jconsole and type ‘localhost:9017’ in the ‘Remote processes’ field and click ‘Connect’ as shown below:
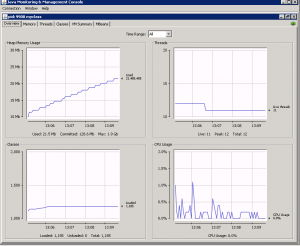
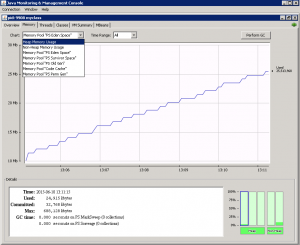
Once connected, you get access to wealth of information. See couple of screen shots below:
Neat, hah?
Next let us look at an another unsung built in monitoring tool – visualvm
Coming up: Troubleshooting GC: VisualVM
Previous: Troubleshooting GC: Step by Step instructions to Analyze Verbose GC logs


Awesome! Its actually awesome article, I have got much clear idea on the topic of
from this article.