Back in the 90s when I was working as a Solaris/HP-UX Administrator, all I needed was two or three commands to figure out what was wrong with a particular Server or Application. I will just glance at ‘vmstat’, ‘iostat’ and ‘top’ for a minute or two and the problem will reveal itself clearly. While those command still prove valuable at a certain level, in order to answer ‘Why is the application slow’ you need much more than just few OS commands.
JEE
Answers
1. The Java command line option to enable Verbose Garbage Collection is:
a. –DenableVerboseGC=true
b. –verboseGC=yes
c. –verbose:gc
d. –enable.verbose.gc
e. –XX:+VerboseGC
Answer: c
Explanation: -verbose:gc is the correct answer. All other options are invalid
2. Short lived and Long lived Java objects are stored in these regions of Heap, respectively
a. Tenured,OldGen
b. OldGen,Tenured
c. Tenured,newGen
d. YoungGen,OldGen
e. Tenured,nursery
Answer: d
Explanation: Short lived objects live in Young Generation (also known as nursery or new generation). When minor garbage collection cannot reclaim memory from objects that are still being used (referenced), they get moved to Old gen (via another hop at survivor space). Old gen is also known as tenured gen.
3. Your application uses lots of File Handles. The memory used to maintain these File Handles are stored in which part of JVM memory
a. PermGen
b. YoungGen
c. Tenured
d. OldGen
e. Native Memory
Answer: e
Explanation: Native memory is used for all Operating system level components (such as File handles, sockets etc). Native memory is also used for any native code (such as C libraries) that runs as part of your application. PermGen is used for Class objects (and in some versions, interned strings). Young,Tenured (oldgen) are used to store your application java objects.
4. You have just deployed a new Java application with ONLY out of the box tuning parameters. Upon using the application, users complain your application is extremely slow. By reviewing the verbose GC log file, you have identified that the frequency of GC is extremely high (once every few seconds). What is your best next step ?
a. Tune –Xms and –Xmx to provide reasonable amount of memory
b. Schedule regular automatic restarts of your application
c. Restart your application
d. Increase PermGen Space
e. Add CPU to your Host Server
Answer: a
Explanation: The default Max heap is not enough in most cases (this various by implementation, but typically 128 or 256 MB). So, the best action is to first increase the max heap (-Xmx). You may want to set –Xms (initial heap) to the same value as –Xmx if possible. Otherwise, you can go with half or ¾ th of the Max heap.
5. Your application just ran out memory (OutOfMemory Error) and it has produced a big heap dump file. What is the best tool to analyze this heap dump to find out what is filling up the memory
a. Verbose GC logs
b. Thread Dump analyzer
c. Eclipse MAT (Memory Analyzer)
d. IBM Pattern Modeling and Analysis Tool for Java garbage collector
e. Jstack
Answer: c
Explanation: Eclipse MAT (Memory Analyzer) is the tool to be used for analyzing Heap dumps. Verbose GC logs just show the GC activity in detail, Thread dump analyzer is for analyzing Thread dumps, IBM PMAT is for visualizing verbose GC logs and finally jstack is a command line tool that comes with JDK that can be used to take thread dumps on a running Java application.
Previous: Troubleshooting GC: Test your knowledge
Test your knowledge on Troubleshooting Java Garbage Collection
1. The Java command line option to enable Verbose Garbage Collection is:
a. –DenableVerboseGC=true
b. –verboseGC=yes
c. –verbose:gc
d. –enable.verbose.gc
e. –XX:+VerboseGC
2. Short lived and Long lived Java objects are stored in these regions of Heap, respectively
a. Tenured,OldGen
b. OldGen,Tenured
c. Tenured,newGen
d. YoungGen,OldGen
e. Tenured,nursery
3. Your application uses lots of File Handles. The memory used to maintain these File Handles are stored in which part of JVM memory
a. PermGen
b. YoungGen
c. Tenured
d. OldGen
e. Native Memory
4. You have just deployed a new Java application with ONLY out of the box tuning parameters. Upon using the application, users complain your application is extremely slow. By reviewing the verbose GC log file, you have identified that the frequency of GC is extremely high (once every few seconds). What is your best next step ?
a. Tune –Xms and –Xmx to provide reasonable amount of memory
b. Schedule regular automatic restarts of your application
c. Restart your application
d. Increase PermGen Space
e. Add CPU to your Host Server
5. Your application just ran out memory (OutOfMemory Error) and it has produced a big heap dump file. What is the best tool to analyze this heap dump to find out what is filling up the memory
a. Verbose GC logs
b. Thread Dump analyzer
c. Eclipse MAT (Memory Analyzer)
d. IBM Pattern Modeling and Analysis for Java garbage collector
e. Jstack
Coming up: Troubleshooting GC: Test your knowledge – Answers
In your Application support/Developer Journey, you will definitely come across a time where you will want to really dive into the Java heap and see what is filling up the memory. We are literally talking about all those java objects that are in the heap. Mind you this can run into hundreds of millions in numbers. How do you get an insight into what is in the Heap? By analyzing a Heap dump. And how do you analyze the heap dump? By using the all-powerful Eclipse Memory Analyzer (MAT)
Before we begin using MAT, how do you capture heap dump?
Now, this varies from application to application. For example, if you are running IBM WebSphere, you could use a wsadmin script to invoke heap dump. Earlier you saw visualvm can create a heap dump for you through the visualvm interface. You can also use the command ‘jmap’ to create heap dump. Further you can configure the Application server to automatically perform a heap dump when an ‘out of memory’ error is encountered (XX:-HeapDumpOnOutOfMemoryError). Note that this option is verified to work on Oracle Hotspot JVM only.
Downloading Eclipse MAT:
IBM has given us a great tool that we can use to analyze verbose GC files literally in seconds. I’m not kidding. All you have to do is generate verbose GC logs for few hours and feed the file to this tool and Bingo; it analyzes the file and tells you what you need to know. Let’s see this tool in action.
Downloading IBM Pattern Modeling and Analysis Tool for Java Garbage Collector:
https://www.ibm.com/developerworks/community/groups/service/html/communityview?communityUuid=22d56091-3a7b-4497-b36e-634b51838e11
Click on the ‘download’ link at the bottom of the page. You will get a jar file named “ga<version>.jar”.
For example, ga456.jar.
Invoking IBM PMAT:
VisualVM is a free monitoring tool for the JVM. It is much more feature rich than Jconsole. It comes built in on the Oracle JDKs. You can also download a standalone version from visualvm.java.net.
Invoking visualvm:
The tool ‘jvisualvm’ is located in bin directory under ‘JDK Home’.
Jvisualvm
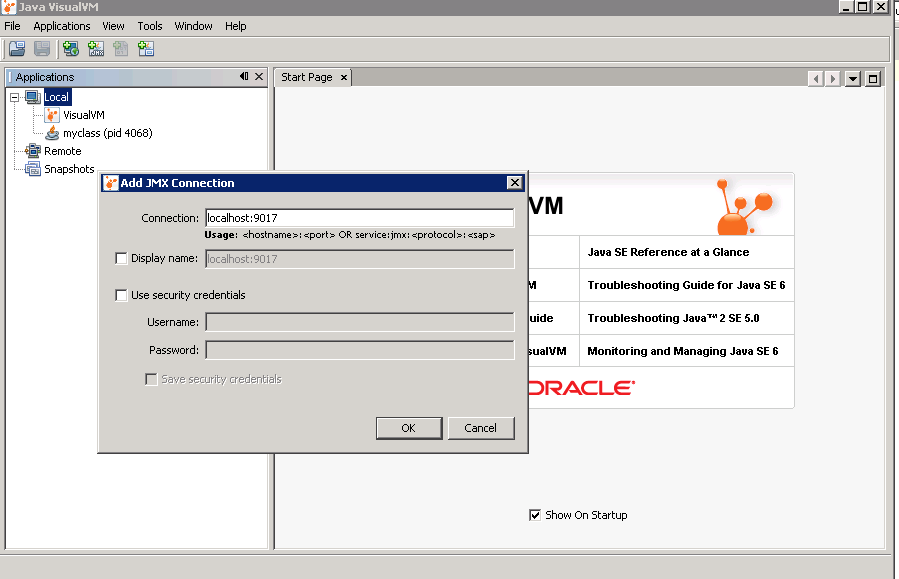
Note, similar to jconsole, if you are running visualvm with the same user id as the application, the application will appear under ‘Local’ and you can begin monitoring right away. However, if that is notthe case, you must first enable JMX remote management by adding the following parameters to the Java command line.
One of the built-in tools that can be used to view the memory usage graphically is jconsole. It comes with JDK. Jconsole uses JMX (Java Management Extension) to pull several vital stats from the running Java application. While jconsole may seem little outdated (and it is) it is still valuable if you want a quick GUI to view JVM stats
How to invoke Jconsole ?
So you enabled verbose GC logs and obtained the logs. Congratulations. You have done one of the most important steps in troubleshooting JVM memory issues. But merely having the log does not do any good. You need to analyze and determine if there is a smoking gun. Here is how to do it.
1. First make sure you collect the logs for at least few hours. Longer the better.
2. Open the log file in a text editor.
3. You are primarily looking for two things
a. Is the GC happening very frequently?
b. Is each GC cycle taking long time?
If you have to choose only one tool to troubleshoot Java memory related issues, you must choose the ‘verbose gc logs’. Verbose GC log has so much information that you can diagnose almost all types of memory issues just by carefully reviewing the data in this file. It is such a valuable tool.
What’s more? The load exerted on the JVM due to verbose GC logging is virtually nothing. So, don’t skimp on enabling verbose gc logs when you need to.
What exactly do the verbose GC logs reveal?
If you think you will never run into out of Memory error because your code is leak proof and your application server is rock solid, think again. Your application can run out of what eludes most developers and Systems Administrators – Native memory.
To put it blunt, Native memory is the memory used by JVM itself for its internal low-level tasks (for example file handles) and the memory used by any native code (such as a C library within the JVM).
What are the symptoms of native memory issues?
1. Unexpected application errors
2. One of the following error message in the log file
a. java.lang.OutOfMemoryError:Detail Message: request <size> bytes for <reason>. Out of swap space?
b. java.lang.OutOfMemoryError:Detail Message: <reason> <stack trace> (Native method)
Note that the errors above are for Oracle HotSpot. The error varies by the JVM vendor.
What causes native memory issue?
Note that the JVM is just a process as far as OS is concerned and hence it is subject to all resource restrictions that the OS poses. Here are some of the major causes of native memory issues
1. Application code issue where fault code creates tons of low level elements (such as File handles,network sockets etc).
2. Third party library code issue (for example C libraries) that suffer from memory leaks
How to prevent native memory issue?
There is not a lot you can do to prevent a native memory issue as these issues are totally unexpected.
But you can try the following
1. Ensure the third party native libraries you use are correct versions and for the appropriate OS and architecture
2. Ensure the application code does not leave lingering network or file handles.
One useful way to determine if you have native memory issue is to check the ‘process size’ of the JVM viewed using operation system tools (for example ‘top’ in Unix). This process size will include Heap and native memory used.
Moving on, let us explore various troubleshooting tools available to aid you with Memory issues
Coming up: Troubleshooting GC: Using Verbose GC logs