VisualVM is a free monitoring tool for the JVM. It is much more feature rich than Jconsole. It comes built in on the Oracle JDKs. You can also download a standalone version from visualvm.java.net.
Invoking visualvm:
The tool ‘jvisualvm’ is located in bin directory under ‘JDK Home’.
Jvisualvm
Note, similar to jconsole, if you are running visualvm with the same user id as the application, the application will appear under ‘Local’ and you can begin monitoring right away. However, if that is notthe case, you must first enable JMX remote management by adding the following parameters to the Java command line.
Very critical Note: Use the options below ONLY in development environment as it opens serious loop holes.
Add the following command line options to the java command line of your application and restart the application:
-Dcom.sun.management.jmxremote.port=<portNum>. For example,
-Dcom.sun.management.jmxremote.port=9017
-Dcom.sun.management.jmxremote.authenticate=false
-Dcom.sun.management.jmxremote.ssl=false
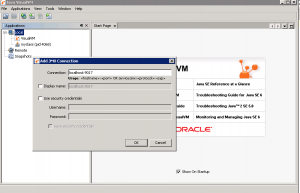
Once the application is restarted, you can connect to it from visualVM by adding a ‘JMX connection’ as shown above (right click on ‘Local’ and choose ‘Add JMX Connection’)
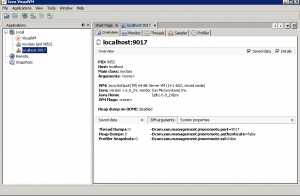
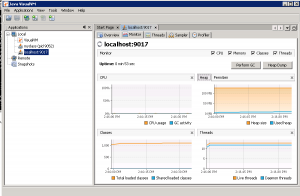
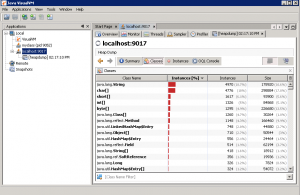
Once connected, you can play with various graphs, even take a heap dump on the fly and analyze it. See the screen shots below:
Awesome progress!! You have come a long way in troubleshooting JVM Memory issues. Now, you must be thinking – this is all good, but is there a tool that can do the research for me and just display the results and recommendations? You are in luck. IBM has just the right tool for you – IBM Pattern Modeling and Analysis Tool for Java Garbage Collector. This neat tool takes your verbose GC log and does the analysis for you. Let’s take a look.
Coming up: Troubleshooting GC: Using IBM Pattern Modeling and Analysis Tool for Java Garbage Collector
Previous: Troubleshooting GC: Using JConsole


