IBM has given us a great tool that we can use to analyze verbose GC files literally in seconds. I’m not kidding. All you have to do is generate verbose GC logs for few hours and feed the file to this tool and Bingo; it analyzes the file and tells you what you need to know. Let’s see this tool in action.
Downloading IBM Pattern Modeling and Analysis Tool for Java Garbage Collector:
https://www.ibm.com/developerworks/community/groups/service/html/communityview?communityUuid=22d56091-3a7b-4497-b36e-634b51838e11
Click on the ‘download’ link at the bottom of the page. You will get a jar file named “ga<version>.jar”.
For example, ga456.jar.
Invoking IBM PMAT:
Just execute the following command
java –jar ga456.jar
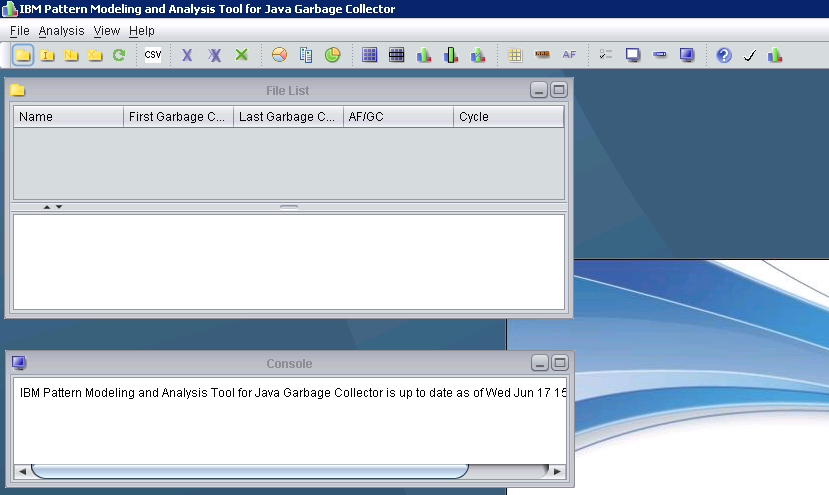
The opening screen will look like the following:
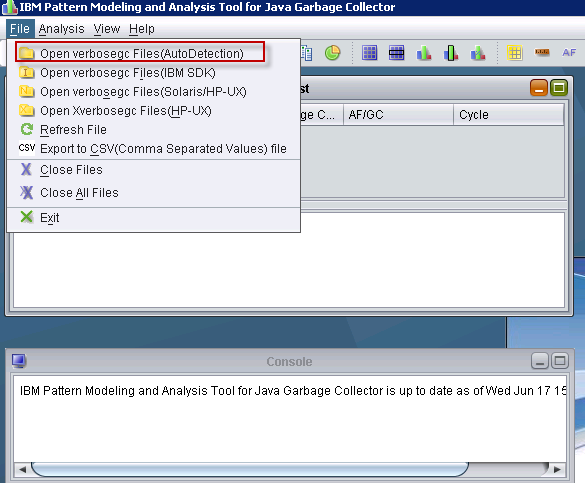
Click on File -> Open Verbosegc Files (AutoDetection) and choose the verbose gc log file.
That’s it. The tool analyzes the log file and produces a neat report. It provides recommendations, if any.
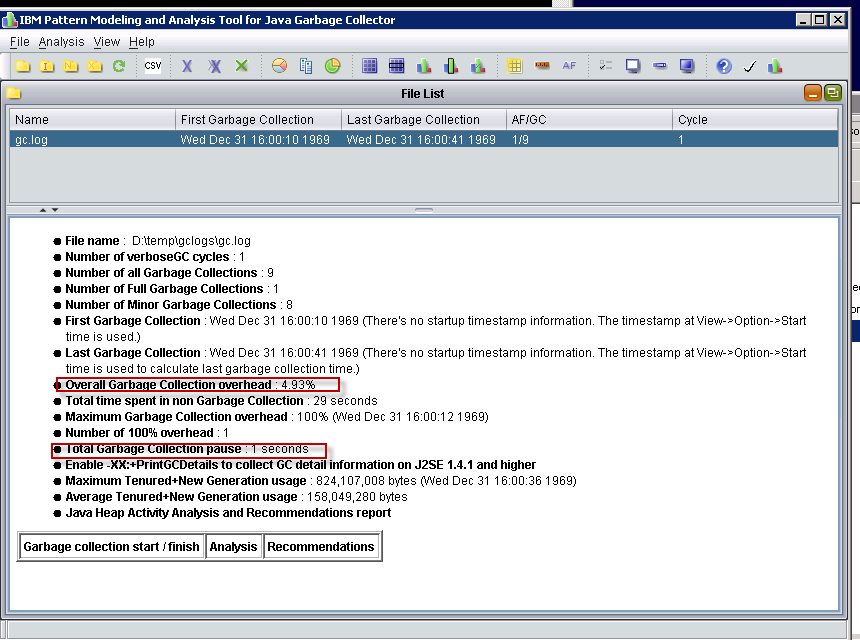
Couple of important metrics that this tool provides:
1. Overall garbage collection overhead (%)
2. Total Garbage Collection Pause (seconds)
Please note that while this tool does its best to give you recommendation, use your own judgement too, as the tool may not know the specific nature of your application.
Great going. There is one last tool that you must add to your arsenal. This tool will blow your mind with its intuitive graphs and the amount of insight it can give you about your application. This tool can analyze heap dumps with hundreds of millions of objects. And yes, it doesn’t cost a dime to download and use it. Welcome to Eclipse Memory Analyzer (MAT)
Coming up: Troubleshooting GC: Eclipse Memory Analyzer (MAT)
Previous: Troubleshooting GC: Using VisualVM