In your Application support/Developer Journey, you will definitely come across a time where you will want to really dive into the Java heap and see what is filling up the memory. We are literally talking about all those java objects that are in the heap. Mind you this can run into hundreds of millions in numbers. How do you get an insight into what is in the Heap? By analyzing a Heap dump. And how do you analyze the heap dump? By using the all-powerful Eclipse Memory Analyzer (MAT)
Before we begin using MAT, how do you capture heap dump?
Now, this varies from application to application. For example, if you are running IBM WebSphere, you could use a wsadmin script to invoke heap dump. Earlier you saw visualvm can create a heap dump for you through the visualvm interface. You can also use the command ‘jmap’ to create heap dump. Further you can configure the Application server to automatically perform a heap dump when an ‘out of memory’ error is encountered (XX:-HeapDumpOnOutOfMemoryError). Note that this option is verified to work on Oracle Hotspot JVM only.
Downloading Eclipse MAT:
Eclipse MAT can be downloaded as a standalone client from https://eclipse.org/mat/downloads.php
Invoking Eclipse MAT:
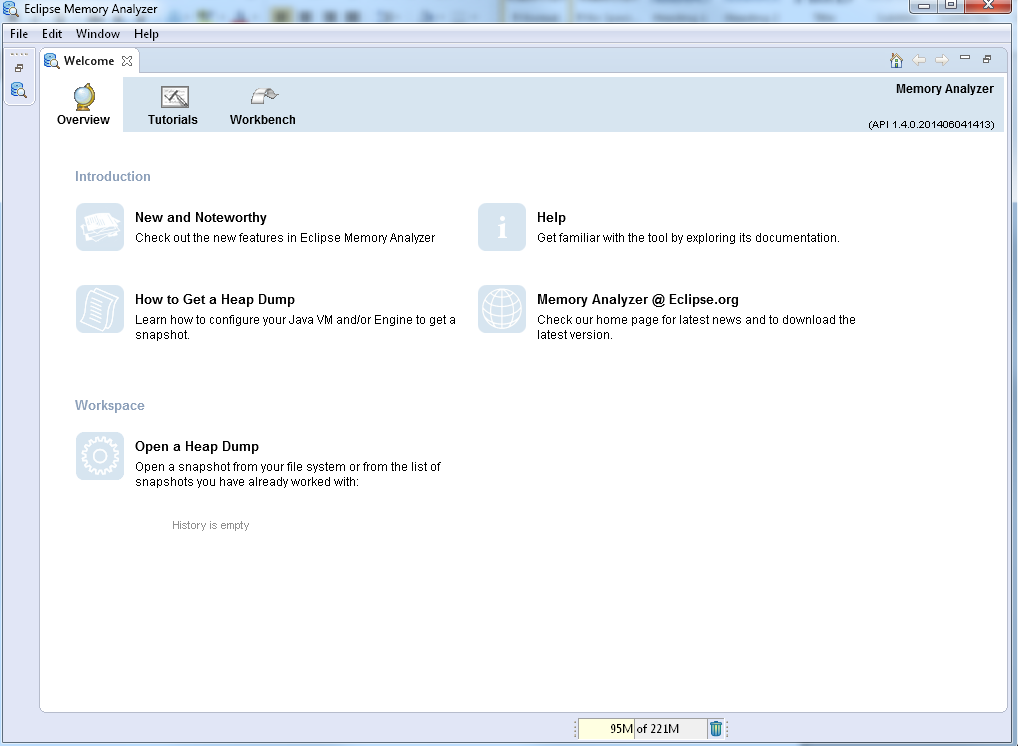
Unzip the download and execute MemoryAnalyzer.exe (windows) under the ‘mat’ directory.Opening screen looks like below:
Click on File-> Open Heap dump and choose your heap dump file (typically HPROF format)
Note: If loading the heap dump file fails, you may have to increase the Max heap for MAT by updating –Xmx in MemoryAnalyzer.ini file
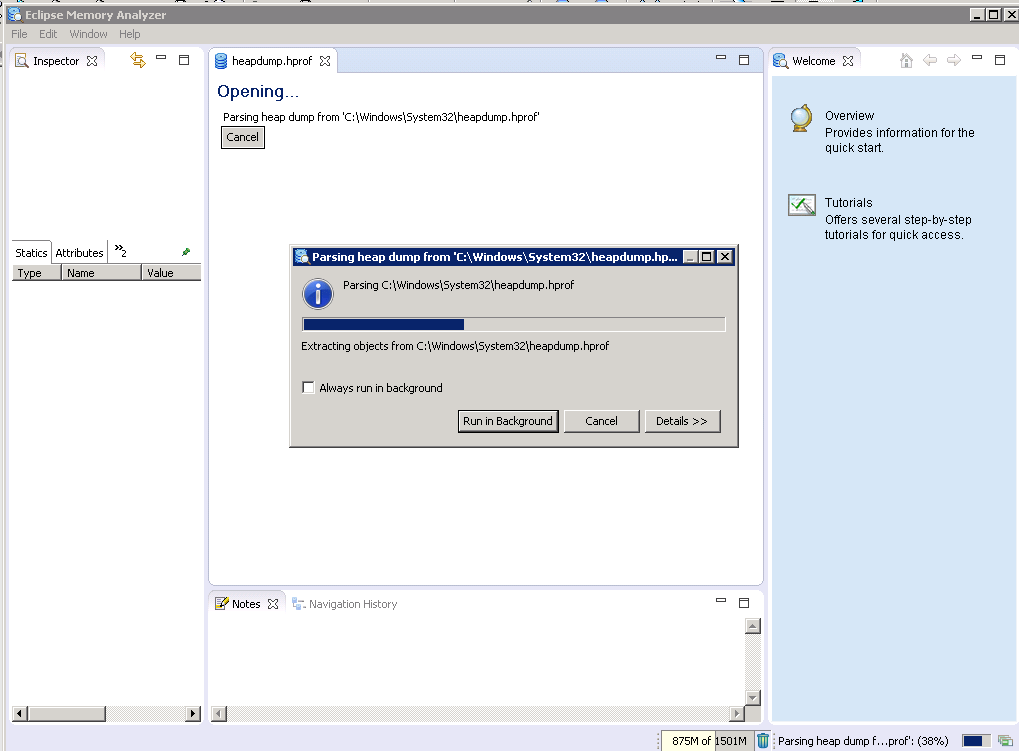
Depending on the size of the heap dump file, it will take a bit to load the heap dump.
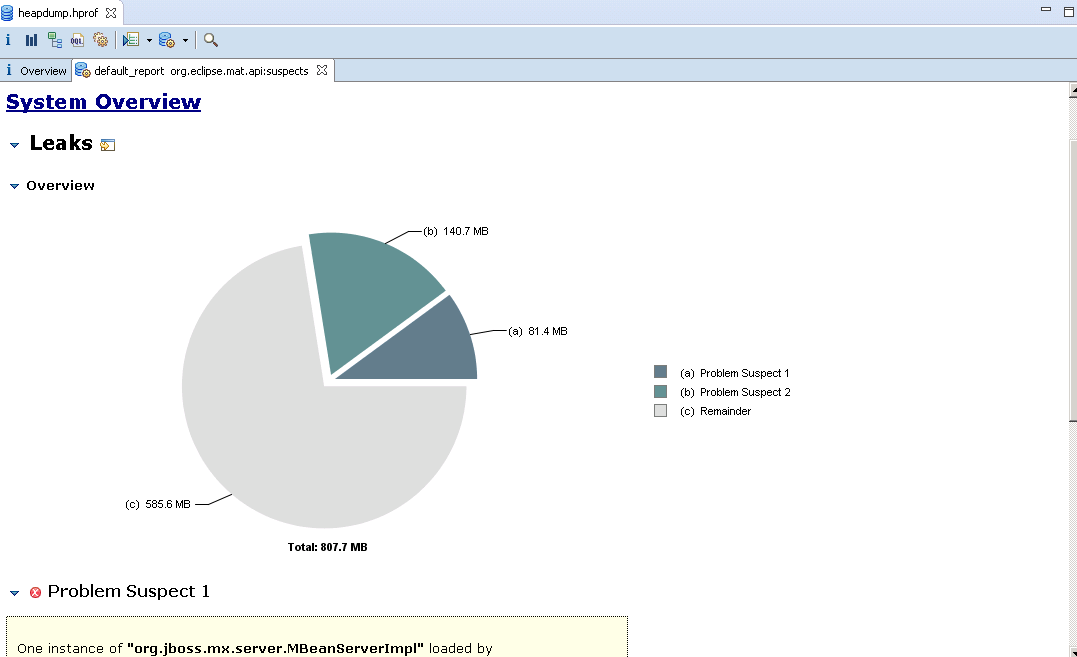
Once loaded, you are given option to open few types of reports. Choose the ‘Leak Suspect Report’. The resulting screen shows several useful metrics.
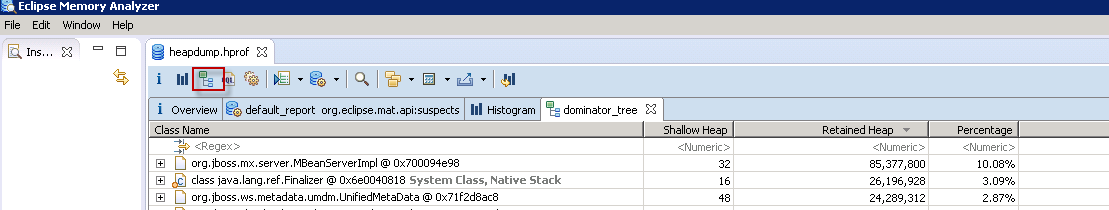
Another useful view is the ‘dominator tree’ where you can see the biggest objects living inside the heap.
In order to fully see the power of this tool, you really have to experience it yourself. Download it and have fun.
Woah!!! You dun it. . Just with the information you have learnt so far, you can figure out almost all usual memory issues. The best way to learn anything is to actually do it. So, take a shot at any of the tools I mentioned earlier and you will be on your way to becoming a Java troubleshooting expert.
Now, to test your knowledge, I have five questions in my next post. If you followed along carefully, you will have no issues answering them. Enjoy…
Coming up: Troubleshooting GC: Test your knowledge
Previous: Troubleshooting GC: IBM Pattern Modelling And Analysis Tool for Java Garbage Collector