by Karun Subramanian
on December 18, 2014
Do you know the single biggest reason why some APM solutions fail?
Do you know what you have to do first before you even begin evaluating various APM solutions?
Do you know the hidden cost in any APM system?
Selecting an APM solution can be tedious task. In this free 18 pages eBook, I present 9 criteria to choose a reliable APM with highest ROI. I’ve derived these criteria based on years of supporting Application infrastructure of various sizes. These criteria will help you clearly understand what exactly you should be looking for in any potential APM solution. You will be ready to ask the right questions when you meet with the APM vendor and will not be caught off guard later.
Enjoy the eBook and Good Luck.
by Karun Subramanian
on December 15, 2014
In this free ebook, I introduce 9 free tools that can be life savers in managing Java Applications. These tools have been time tested, reliable and have helped countless Application Support Engineers and Developers. They DO WORK. These tools can be used to solve problems ranging from ‘Out Of Memory’ errors to ‘Slow’ Applications.
Enjoy.
by Karun Subramanian
on October 30, 2014
Alright. Now let us dive into step-by-step procedure on actually analyzing the Thread Dump.
Step by Step procedure to analyze a Thread dump
1. Open the Thread dump in your favorite text editor.
Note: Java Threadump (aka javacore) is generally a text file that can be opened using any text editor. If you cannot open it, chances are it is not a JVM thread dump. Perhaps you are trying to open a heap dump or an Operating System core file.
2. Search for the string RUNNABLE. If you are running IBM JVM, look for the string “state:R”.
3. There can be lot of RUNNABLE threads. What you want to do is pay attention to the Threads that are running your application code. They will be evident from stack trace. Look for com.<companyname>.<packagename>.<classname>.<methodname>. You can ignore Application Server specific Threads. It is not unusual to see tons of Application Server threads (for example listen sockets) in the Thread dump.
Example: The Thread below is clearly NOT running your application code at that moment
because it does not show any “com.<companyname>.<packagename>.<classname>.<methodname” in its stack trace.
Read More
by Karun Subramanian
on October 26, 2014
Okay. Now that you have some fundamentals drilled in, let us look at how exactly to take the Thread Dump. But even before that, let us answer this question:
Does taking Thread dump kill the Application Server? Are there any side effects?
When you take the Thread dump, the JVM is momentarily paused to dump the stack. This does mean that the JVM is interrupted. But that’s about the effect taking the Thread dump should have on the JVM – a momentary pause. However since it is somewhat intrusive process, there is an extremely rare possibility that it does something adverse to the JVM, like getting aborted. But in practice the cases like this are virtually none.
How do you take a Thread Dump of a JEE Application Server?
Read More
by Karun Subramanian
on October 25, 2014
‘Threads’ is perhaps the most misunderstood component among Application support engineers and even among Software Developers. Take a look at the following questions that we typically come across in our glorious support career:
- What does it mean to say ‘There must be hung Threads’ in the Application?
- Have you exhausted the available Threads in Application Server?
- Which Thread Pool is used for Web Container?
- Do I have to configure the number of JDBC Connections in the connection pool equal to the number of Threads I have in the Application Server?
- How can I find out which thread is currently running in the Application Server?
- Is ‘number of Threads’ configurable? Can I have unlimited Threads?
- How can I find out all Threads that are currently running?
- Is there a Thread Dead Lock going on?
- How can I kill hung Threads?
Well, after going through this three part series, you will be able to answer all the above questions.
What is a Thread?
Read More
by Karun Subramanian
on October 3, 2014
Over half a billion systems are estimated to be impacted by Shellshock aka Bash Bug. The bug opens the door to a hacker to take over system.
Who is impacted ?
If you have Bash installed on your system, you are impacted. Bash, by default, is present on most of the Unix and Mac OS platforms. It does not matter which software products you run on top of the Operating System (such as Application Servers, Database servers etc). If you are Unix or Mac OS, changes are you are impacted.
If you are running Jboss (any Jboss product such as Application Server, EAP, SOA, BPM suites etc) on Windows platform, sit back and relax. Windows does not have bash and you don’t have to worry about Shellshock. However, if you have cygwin installed in your system, then you may be vulnerable as cygwin comes with Bash.
How to implement the fix ?
Trendmicro has the most upto date information on the fix. Check out the link http://www.trendmicro.com/us/security/shellshock-bash-bug-exploit/index.html
Good luck
by Karun Subramanian
on September 13, 2014
When your application server is hung for whatever reason, the end-user experience takes a hit and your reputation as an Application Support engineer tanks. While the most important activity is to restore service, which may involve recycling your application server, you must act swiftly to collect as much diagnostics information as possible before you do that. In my experience, obtaining Java Heap dump and Thread dump are extremely valuable in such cases. Here is how you obtain these dumps for a JBoss Application server. As a matter of fact, this method will equally work for any JEE Application server (even though Application Servers like IBM WebSphere provide utilities/commands to do this)
Here we go:
Read More
by Karun Subramanian
on August 6, 2014
Hi all !
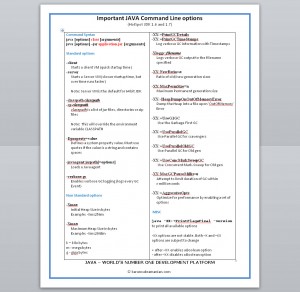
I have put together a one page poster showing the important Java command line options. Download it, print it and stick it in your cube. It will come in handy.
Enjoy !!
PS: It may take about 30 seconds to load
by Karun Subramanian
on August 3, 2014
Have you ever tried to find out the entire command line arguments for the ‘java’ command that starts your application in Windows ? Have you ever tried to find out which files or DLLs are opened by your Java Application in Windows ? The Windows Task Manager is OK but it does not give you the deeper insight that you would need to answer the above questions. Welcome to Process Explorer.
Read More
by Karun Subramanian
on July 27, 2014
Let’s face it. Nobody likes a slow application. It is our job to make sure our applications fulfill the functionality need completely, but at the same time delivers good user experience.
In 16 years of my experience in technical support primarily in the world of JEE, while I cannot honestly say ‘I have seen it all’, I can say “I have seen a lot“. Here are the top 10 reasons why your Java application may slow.
Read More