What good is an APM solution without a solid Alerting system that is easy to configure? Appdynamics alerting system is very robust with lots of options to customize.
First of all, AppDynamics comes with several pre built alerts with thresholds that are dynamically learned. This means without configuring anything, you get out-of-the-box alerting. This default alerting is visible in the Dashboard via the coloring scheme (for example, a node icon turning RED). However, the default alerting is not enough for most cases. You would want to customize the default ones, and perhaps add your own.
Two major components of Appdynamics Alerting system
- Health Rules
- Health Polices
Health Rules
Health Rules define the thresholds for metrics. For example, a rule might be setup to trigger a ‘warning’ condition when a business transaction exceeds certain response time.
Appdynamics comes with predefined health rules. To view these rules, navigate to Alert & Respond -> Health Rules.
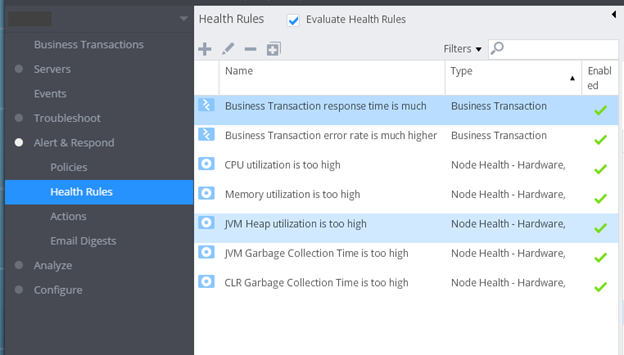
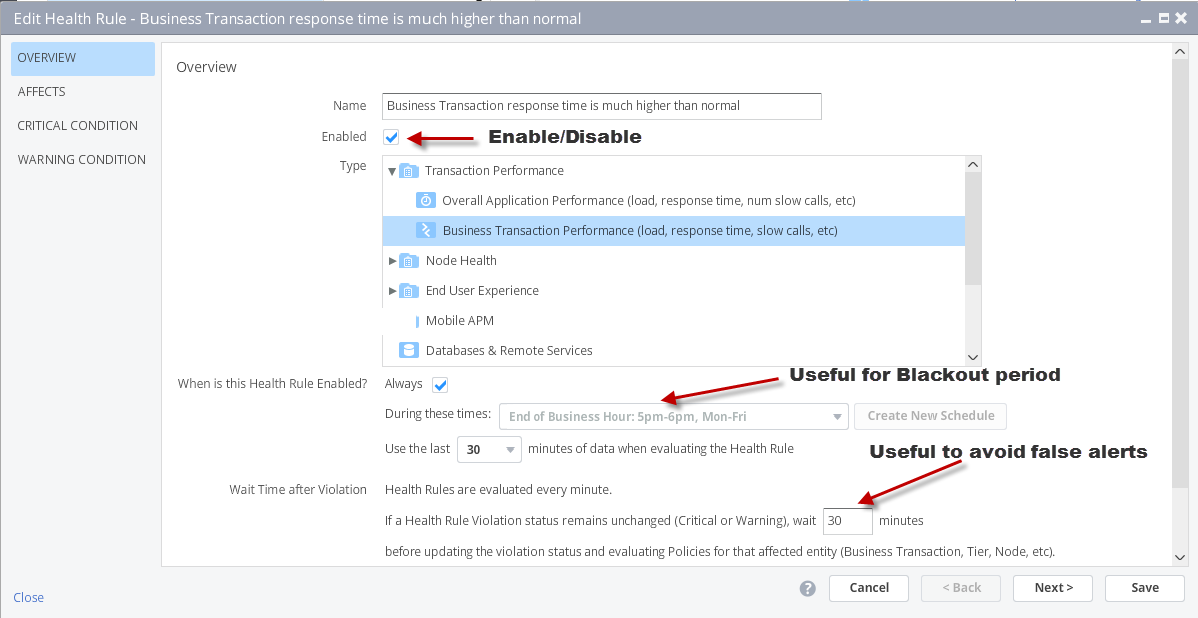
You will see several pre-defined health rules. Let us explore one of the health rules to learn the components that make up a health rule. Double click on the first rule ‘Business Transaction response time is much higher than normal’.
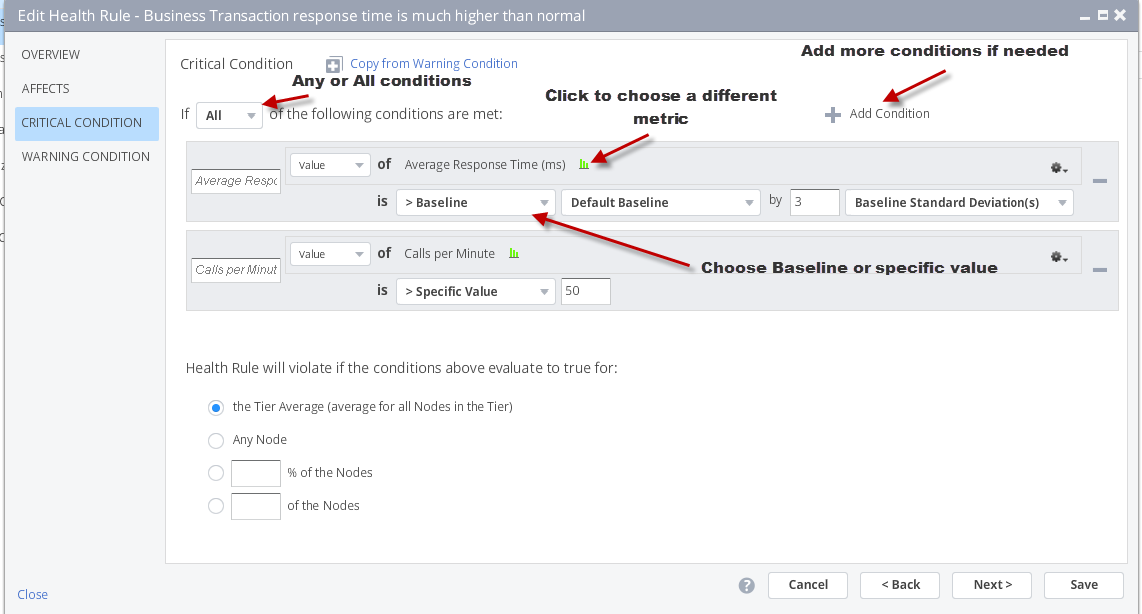
Configure critical condition. These are typically higher thresholds that would indicate a serious issue or outage.
Configure ‘Warning’ Settings. This is typically set at a lower threshold to catch issues before turning out to be complete outages.
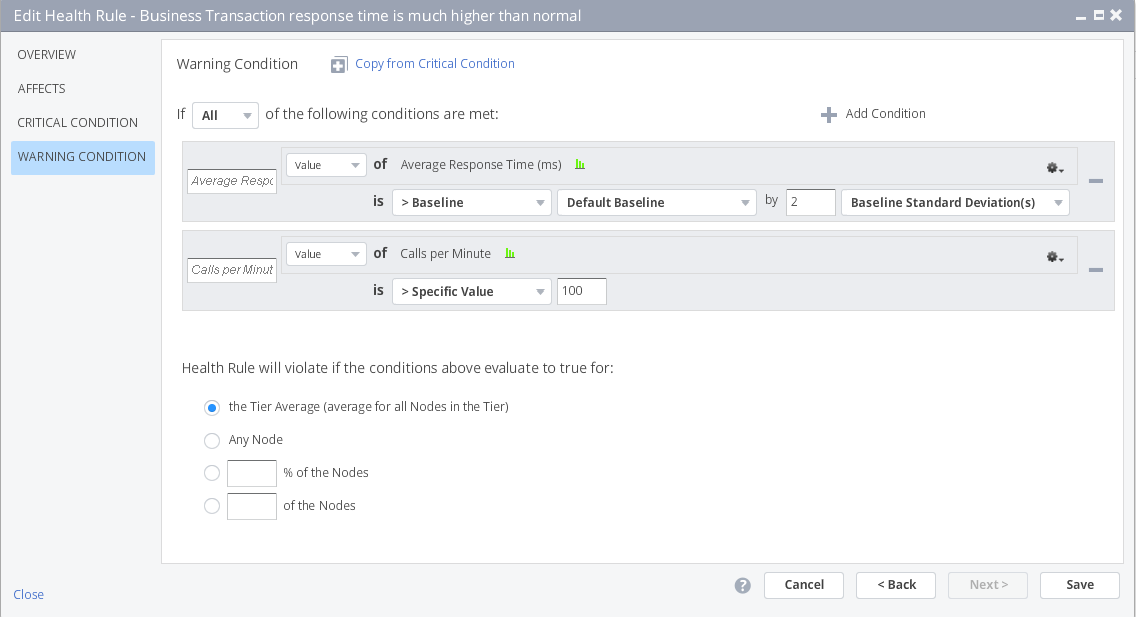
You can play with all the available options to choose the ones that suite your environment.
Health Policies
Just having the Health rules doesn’t do much. It does help with color coding in the Dashboard but that means someone has to look at the screen 24 X 7. A much practical approach is to configure an email or pager alert when the Health rules are violated. You achieve this using Health Polices (or Policies).
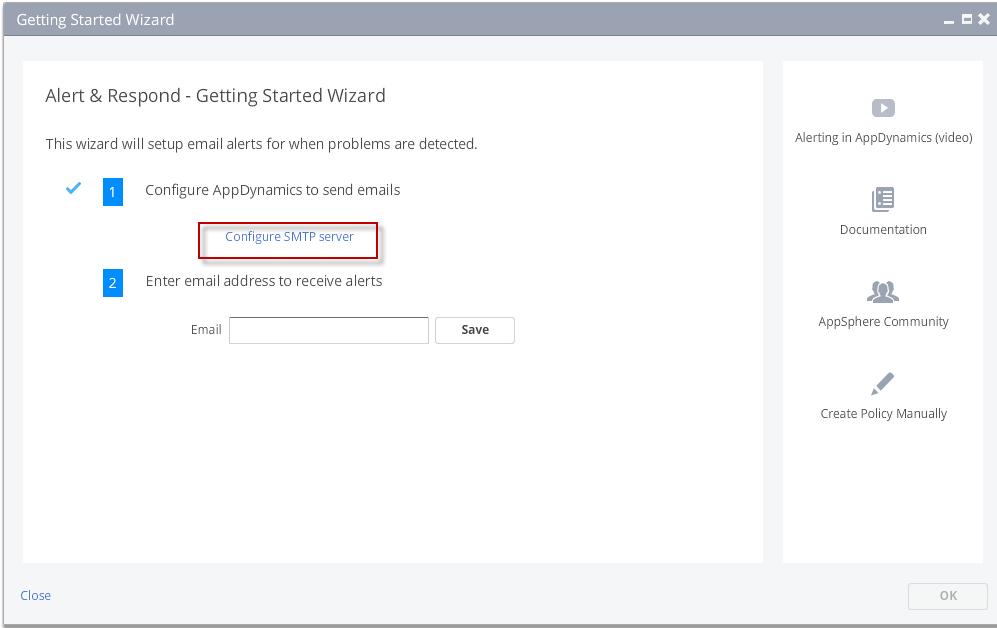
By default there no policies defined. You have to create your own policies. Navigate to Alert & Respond -> Policies. Click on the ‘getting started’ wizard.
First thing you want to do is configure your email setup.
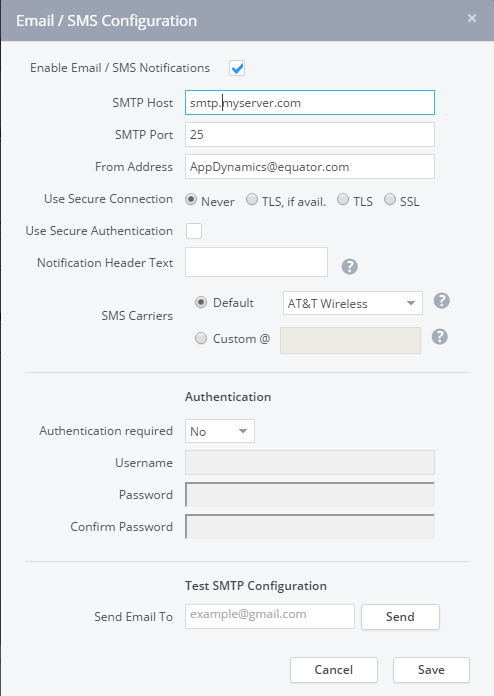
For Email, you need to know the hostname and port number (usually 25) of your email server. Contact your Systems Administrator if you don’t have this information.
Enter a valid email to which you want the alerts sent (You can update this later)
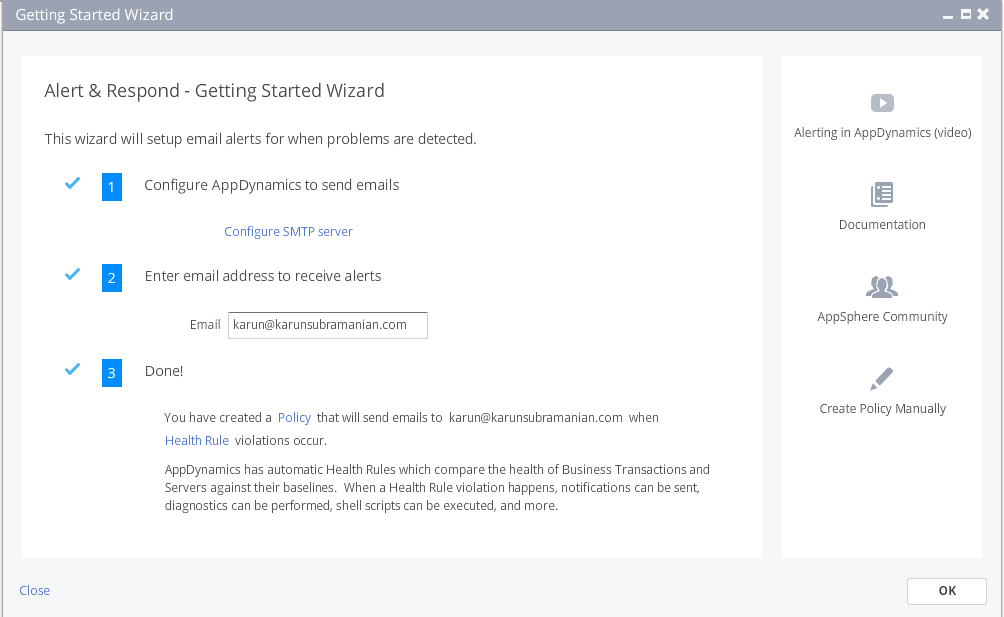
Click Save and you are done. Click OK to exit this screen. You will see a new policy that has just been created (named My policy).
Double click on ‘My Policy’ to open it.
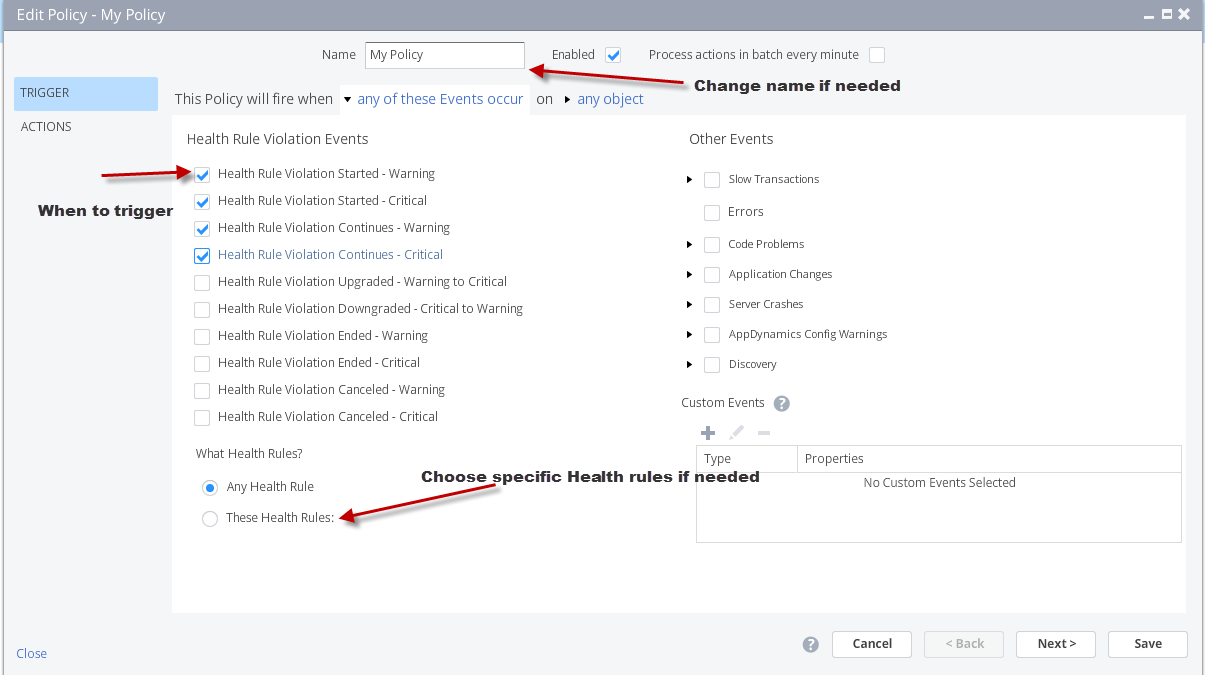
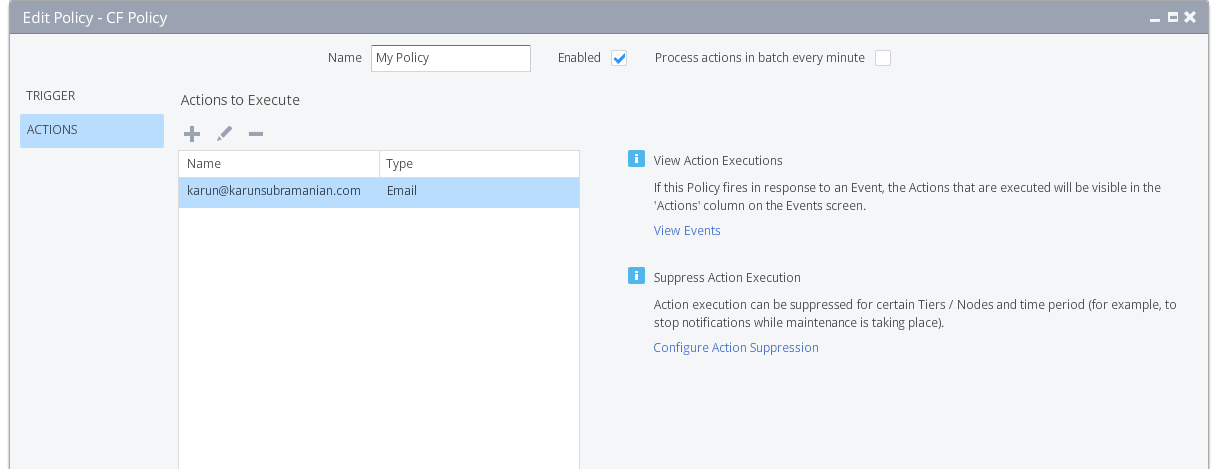
Click ‘Next’ to go the ‘Actions’ tab where you can configure the action to be taken when the selected health rules are violated.
There you have it. Note that I have covered Alerts at a very high level only. But this should get you started.
Happy Monitoring !!
Comments on this entry are closed.