Alright. Now let us dive into step-by-step procedure on actually analyzing the Thread Dump.
Step by Step procedure to analyze a Thread dump
1. Open the Thread dump in your favorite text editor.
Note: Java Threadump (aka javacore) is generally a text file that can be opened using any text editor. If you cannot open it, chances are it is not a JVM thread dump. Perhaps you are trying to open a heap dump or an Operating System core file.
2. Search for the string RUNNABLE. If you are running IBM JVM, look for the string “state:R”.
3. There can be lot of RUNNABLE threads. What you want to do is pay attention to the Threads that are running your application code. They will be evident from stack trace. Look for com.<companyname>.<packagename>.<classname>.<methodname>. You can ignore Application Server specific Threads. It is not unusual to see tons of Application Server threads (for example listen sockets) in the Thread dump.
Example: The Thread below is clearly NOT running your application code at that moment
because it does not show any “com.<companyname>.<packagename>.<classname>.<methodname” in its stack trace.
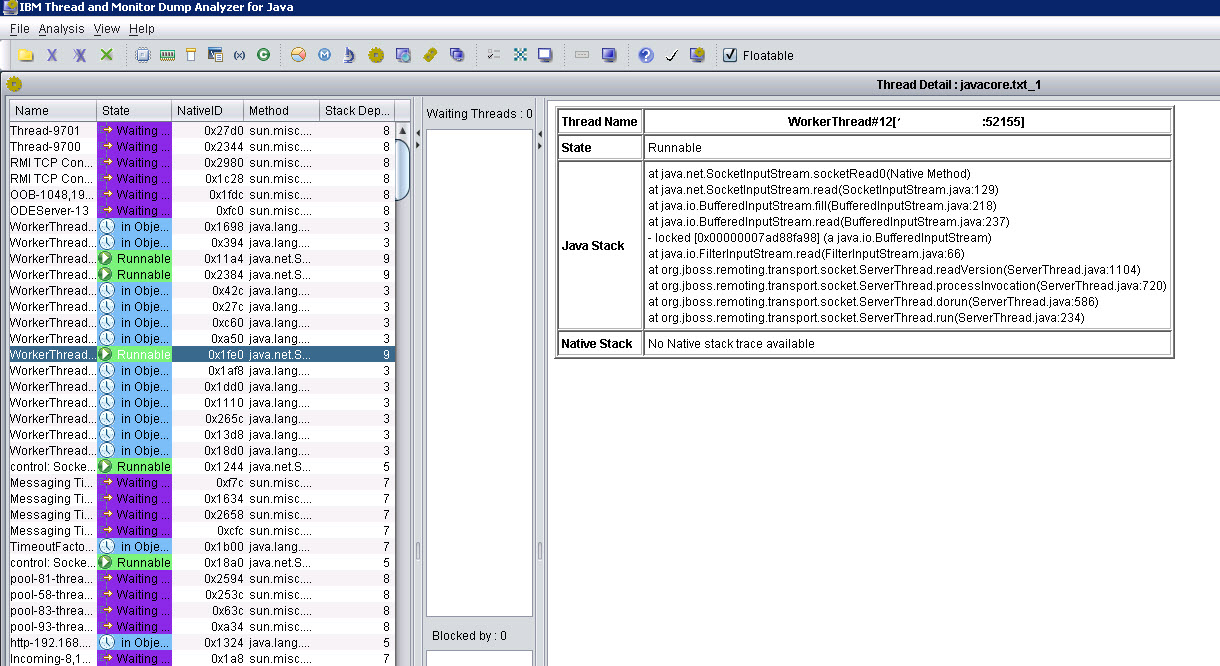
“control: Socket[addr=/190.184.61.31,port=27241,localport=63741]” daemon prio=6
tid=0x000000001437d000 nid=0x1244 runnable [0x000000005673f000]
java.lang.Thread.State: RUNNABLE
at java.net.SocketInputStream.socketRead0(Native Method)at java.net.SocketInputStream.read(SocketInputStream.java:129)
at java.net.SocketInputStream.read(SocketInputStream.java:182)
at java.io.FilterInputStream.read(FilterInputStream.java:66)
at
org.jboss.remoting.transport.bisocket.BisocketServerInvoker$CControlConnectionThread.run(Biso
cketServerInvoker.java:1033)
Locked ownable synchronizers:
– None
4. Once you locate the RUNNABLE threads that are executing your application code, find out which method is being executed by following the stack trace. You may get assistance from development team if needed. Also note the Thread ID.
5. Now open the other thread dumps that you took and see if the Thread ID identified in the
previous Thread dump is still executing the same method. If it is, you are closing in on the
root cause. Open the next Thread dump and see if the same Thread is doing the same thing. If it is, you have a solid lead in finding the root cause.
6. Find out what exactly the method does. May be it is waiting for response from a remote web service. May be it is waiting for response from a Database Server. Whatever it is, that is most likely the root cause.
Note: Another useful observation from a Thread dump is the ‘number of Threads’. If you see the total number of threads in unusually amounts (for example several hundreds or even couple of thousands), you have a problem.
Note: IBM JVM prints a WARNING in SystemOut.log if a Thread has been running for a
configured amount of time.
Note: Weblogic will declare a Thread as ‘Stuck’ if it is active for a configured amount of time (default 600 seconds). The health of the Application Server will also change to ‘WARNING’.
Thread dead locks
Occasionally you may run into a dead lock situation. Where Thread 1 is waiting for Thread 2 to finish and Thread 2 is waiting for Thread 1 to finish. Few JVMs actually detect the dead locks automatically and print them in Standard Out Log file.
To find out dead locks from Thread Dump, look for the ‘WAITING’ threads and see what it is waiting on. As before, don’t worry about Application Server specific Threads .Just focus on Threads that are running the application code.
Using free tools to analyze Thread dump
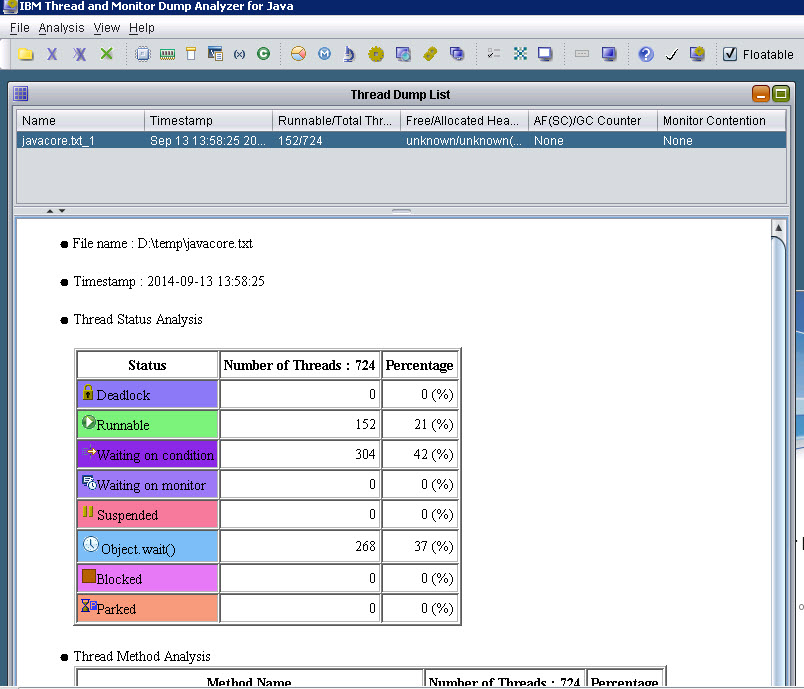
Instead of viewing the Thread dump in a text editor, you can use any of the free Thread dump analyzer tools. My favorite is IBM Thread and Monitor Dump Analyzer for Java. See couple of screen shots below:
Few folks have had success with Samurai, another tool for analyzing Java thread dumps. There is also TDA (Thread dump analyzer) which is primarily used for HotSpot JVM only. And Visual VM has a plugin named ‘Threads Inspector’ which you may want to try out as well.
With this newly gained knowledge, let’s try to answer the questions asked at the beginning of this lesson.
1. What does it mean to say ‘There must be hung Threads’ in the Application Server?
It means one or more Threads are executing the same thing for long duration. Take 3 Thread dumps at 10 seconds interval and check the ‘RUNNABLE’ Threads that are running your application code (the stack trace should tell you if it is running the application code or some application server specific internal code). Mostly hung threads are due to non responding remote systems.
2. Have you exhausted the available Threads in Application Server?
It is possible to exhaust all the Threads in an Application Server. It is a serious issue though. The CPU utilization on the Server will be extremely high (close to or equal to 100%). Take a Thread dump if you can and see all the ‘RUNNABLE’ Threads. It could be cause of a non-responding backend system and your application does not have a timeout (indefinitely waiting for remote system to respond). Note that some Application Server lets you leave the ‘Maximum number of Threads’ dynamic. Meaning the Application server is free to spawn as many threads as possible. This is NOT a good practice. Always have an upper limit on the number of Threads.
3. Which Thread Pool is used for Web Container?
It depends on the Application Server product. For example, with WebSphere, there is a Web Container’ Thread pool that you can configure.
4. Do I have to configure the number of JDBC Connections in the connection pool equal to the number of Threads I have in the Application Server?
No. Number of JDBC connections and number of Threads do NOT have 1:1 relationship. Typically you will have fewer Threads than the number of JDBC connections. This is because the same Thread can be reused for several connections.
5. How can I find out which thread is currently running right now in the Application Server?
Take a Thread dump and look for ‘RUNNABLE’ Threads.
6. Is ‘number of Threads’ configurable? Can I have unlimited Threads?
It depends on the Application Server product you are using. Generally yes. It is configurable. Make sure you have an upper limit (start with perhaps 50 threads) for the Thread Pool. Only a through Load test can help you determine the optimal upper limit. You cannot have ‘unlimited Threads’. It is limited by your hardware. It is NOT good practice to have Application Server ‘automatically expand’ the Thread Pool size, unless you are absolutely sure about what you are doing.
7. How can I find out all Threads that are currently running?
Take a Thread dump. Thread dump reveals ALL the Threads in the JVM. It does not matter which STATE the Thread is in.
8. Is there a Thread Dead Lock going on?
Some JVMs (Jrockit) will print in System Out if there is a dead lock. You can always take a Thread dump and see if there are dead locks. You can use free tools like IBM Thread and Monitor Dump Analyzer for Java to analyze the Thread dump.
9. How can I kill hung (or stuck) Threads?
First of all it is a risky business to forcibly kill a Thread. What if it leaves corrupted data in the database? This is precisely why Oracle deprecated Thread.stop (method). This technically means ‘you cannot kill a Thread in Java’. Restarting the JVM is an option but it will terminate other Threads that may be doing useful work. But every environment is different. If you absolutely know the application you are managing in and out and exactly know what it is doing, you can try interrupting stuck Threads by some creative ways. For example, if the thread is waiting for response from a remote service, can you stop that service? When you stop that service, most probably your application will receive ‘socket closed by peer’ and exit the Thread. But there is no guarantee.Oracle introduced Thread.interrupt that may work in some situations. But you will have to write a program to do this.For WebSphere Application Server, you can try “Hung Thread Interrupter” tool from IBM Alpha Works.
There you have it. Troubleshooting Thread issues, though intimidating, can be made lot easier by carefully analyzing Thread dumps. Why don’t you take a Thread dump of an Application Server (perhaps in your test environment) and start looking around ?. The more you familiarize with Thread dumps, better you will become with analyzing them. Always consult the Application Server manuals when in doubt. Keep reading articles related to Threads and Thread dump Analysis available on the Internet. Before you know you will be a master at troubleshooting using Thread dumps.
Good luck.


what a wonderful, clear & crisp article.. Thank you so Much.. Keep spreading the knowledge.
Thanks Ganesh
Very nice article. Keep posting.
Arun, Good info step by step. Thanks.
Nice and crisp content..superb
Very good info