Have you ever tried to find out the entire command line arguments for the ‘java’ command that starts your application in Windows ? Have you ever tried to find out which files or DLLs are opened by your Java Application in Windows ? The Windows Task Manager is OK but it does not give you the deeper insight that you would need to answer the above questions. Welcome to Process Explorer.
Windows Process Explorer is a Windows Sysinternals tool that is free to download from technet website.
Once you unzip the tool, invoke ‘procexp.exe’ to launch the tool.
Accept the license agreement and/or Warnings that may appear.
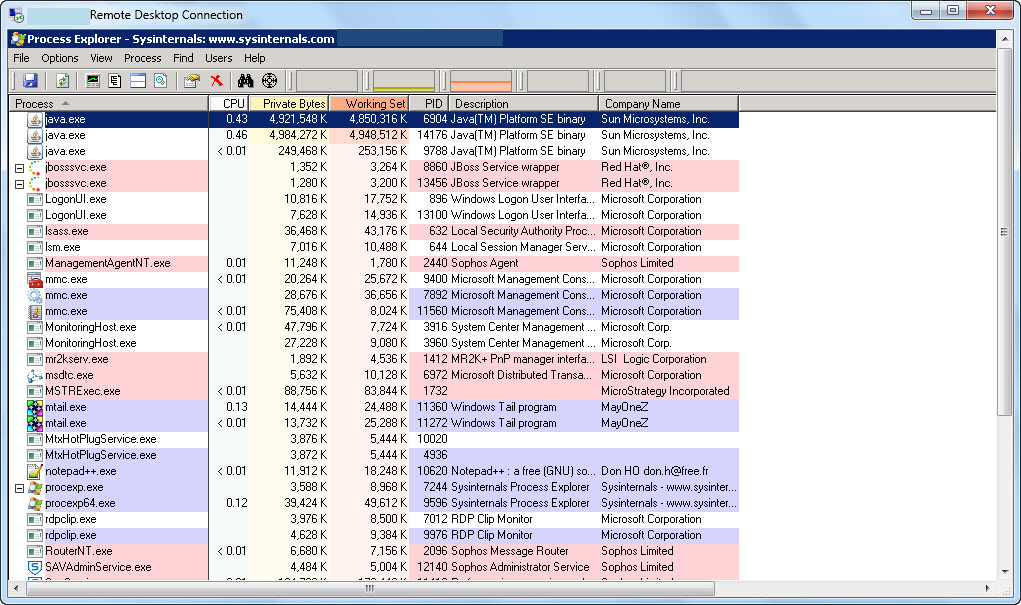
The opening screen might look something like this:
How to find the files/dlls opened by your application ?
Click on your Application process
Click on View -> Show Lower Pane
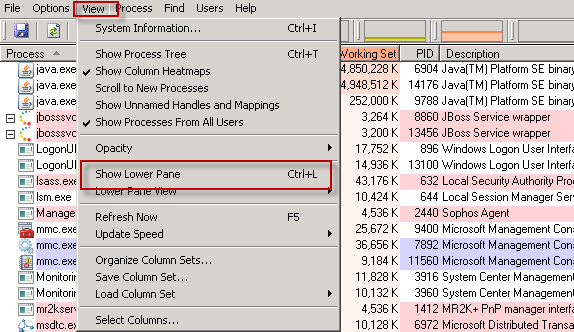
Click on View -> Lower Pane View -> Handles

Now the lower pane shows all the files opened by your application. Obviously, we will see some JRE jar files as shown below

How to find the full command line of the java application ?
Couple of ways:
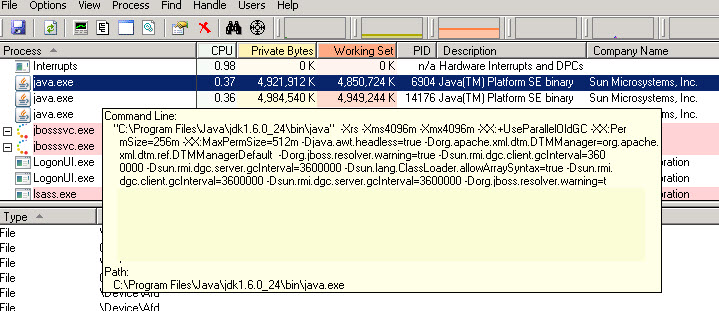
Just hover over the mouse on the process and a window will pop up showing the entire command line.
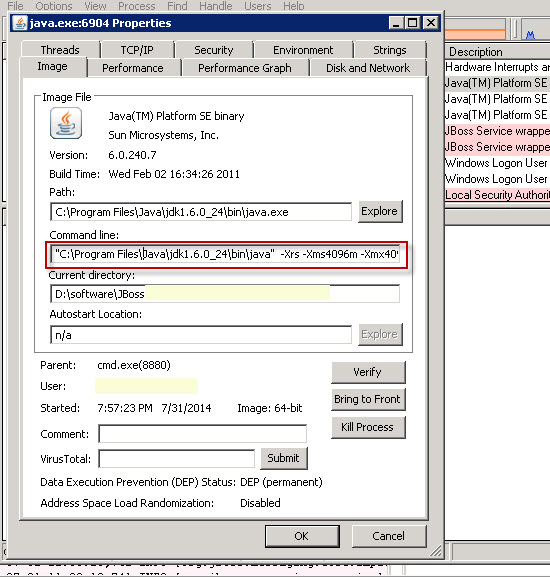
Or you can double click on the process to bring up a window that shows detailed information about the process. Around the middle, you will find the field ‘Command line’. You can copy and paste the text to notepad to see the entire command line.
If you are adventurous, explore the other tabs such as ‘Threads’, ‘TCP/IP’ etc. They may have useful information for you.
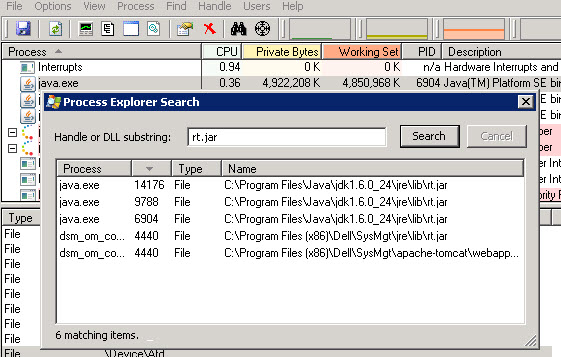
How to find which processes have certain files/dlls opened ?
Finally, you can search for a file or DLL within Process explorer to find out which process has the file or dll opened. This is a very powerful feature. Just click on Find -> File Handle or DLL (Or press the infamous Ctrl F)
There you have it. A very powerful yet free tool that can be really useful during troubleshooting of Java environment related issues. You can get deeper insight to the process such as files/dlls opened, Network sockets opened and some Thread level information.
Happy troubleshooting 🙂