Application monitoring is vital for any organization. But implementing and maintaining a reliable Application monitoring system can be a very complex process, primarily because of the number of various metrics that can be monitored. In this article, I would like to take you back to the basics, and explain two chief metrics that you must monitor no matter what your application is or does.
Before we jump in, I would like to mention that ‘Application availability’ monitoring is the absolute anchor (a monitor that tells weather your application is up and running or not). This is when the users get the dreaded ‘page cannot be displayed’. The two metrics I’m about to elaborate are in addition to the availability monitoring.
These two metrics may sound obvious, yet I have seen organizations miss these all the time.
Without further due, here they are:
1. Throughput aka Load aka Number of requests per interval
You will invariably get this question from someone when there is a performance issue being dealt with.
What is current load on the System?
How many users are on the Application right now?
What is the throughput that you are seeing current?
More importantly, what were the values for the above metrics yesterday, last week the same day, last month?
Throughput is the number of requests your application is processing per interval (interval being seconds, minutes, hours or even days depending on your application). It is in an indicator of how much work your application is doing.
How to measure throughput of your Application?
It can be tricky, depending upon the technology and configuration your application using which varies greatly. For example, if yours is a Web application accessed via a standalone Apache Web Server, a glance at access.log can tell you the number of hits to your web server. But I take it that your application is much more complex than that – with perhaps a cluster of Application Servers and web Servers load balanced by a F5 load balancer.
How do you measure the through put in this case?
If you are really serious about being on top of your application health, you will have to invest (or convince your supervisor to invest) in an APM (Application Performance Management) product which can present complex data from several sources in one unified dashboard. These APMS continuously record data so you have historic information with a click of a button. Nice.
2. Response time
How fast is your application responding to the user requests? If your application is not fast and responsive, you are going to have frustrated users. But sadly, there are gazillion variables involved in determining the root cause of poor user experience. But at the least, you should find out about a problem before the user does so that you look credible and reliable, and for this reason, you should constantly monitor the average response time of your application.
How to measure Response time?
Just like throughput, measuring response time depends on the technology being used and the configuration involved. In the rudimentary case we discussed earlier (one apache web server), it is a matter of configuring the access log to include ‘time taken’ for each http request. But again, your application is usually more complex than that.
Once again, a commercial APM solution is what you need to conquer metrics like ‘Response time’ which can hard to derive in environments that involve multiple subsystems.
Here is couple of screen shots from two popular APM vendors
App Dynamics:
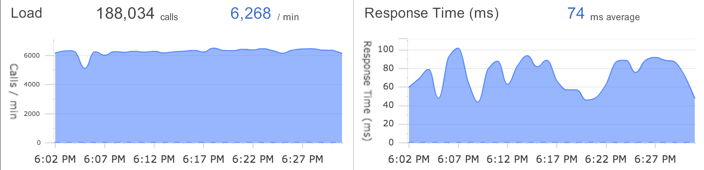
Source: blog.appdynamics.com
New Relic:
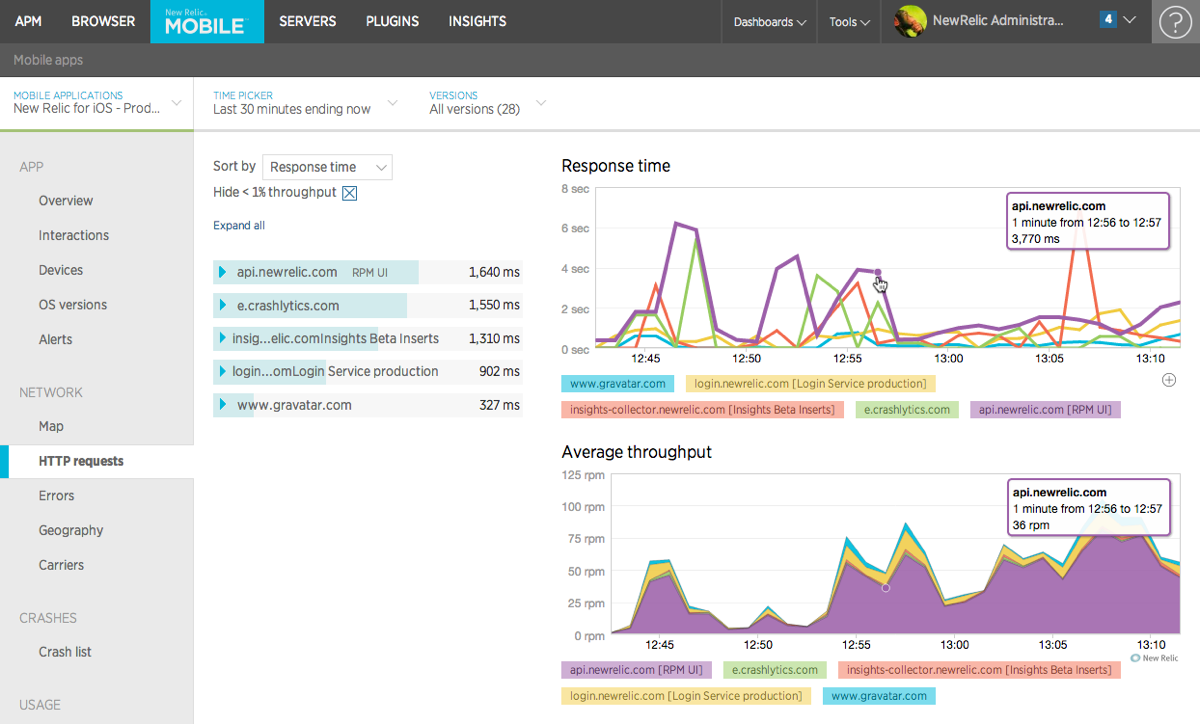
Source: newrelic.com
There you have it. Of the numerous metrics you can monitor for you Application, don’t forget to monitor the two fundamental metrics – Throughput and Response time. Make sure you can easily access historic data for these metrics so that you can compare (for example, before and after a release). Commercial APMs make the gruesome convoluted task of setting up reliable application monitoring a walk in the park (almost :)).
Good Luck