Back in the 90s when I was working as a Solaris/HP-UX Administrator, all I needed was two or three commands to figure out what was wrong with a particular Server or Application. I will just glance at ‘vmstat’, ‘iostat’ and ‘top’ for a minute or two and the problem will reveal itself clearly. While those command still prove valuable at a certain level, in order to answer ‘Why is the application slow’ you need much more than just few OS commands.
The Systems and Applications are lot more complex than what it used to be. Starting from a user’s browser, for example, a users’ request can traverse through numerous sub systems before getting a response. Take a look at a modern application infrastructure:
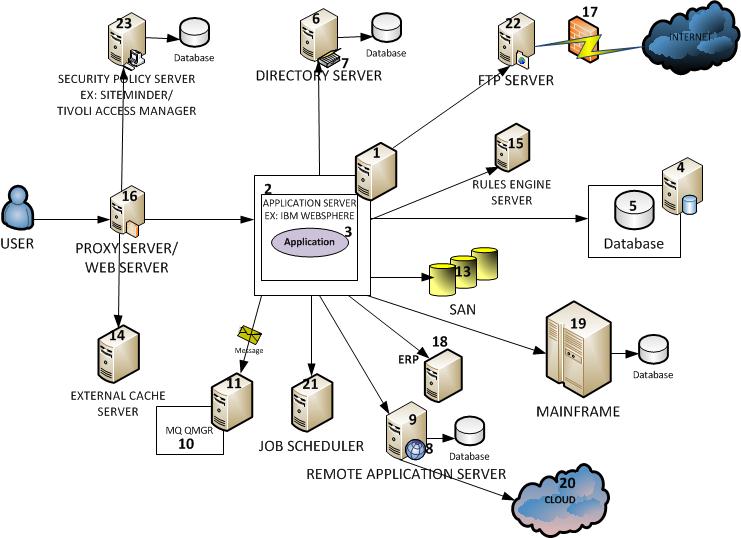
You can readily see that there are more than 20 failure points.
As an application support and operations professional, what you need is a comprehensive tool that can provide a unified view of entire application infrastructure – say Hello to Application Performance Management Tools.
A well maintained APM tool is a critical component of your Application infrastructure. In some cases, lack of a top of the line APM implementation can cause havoc. Imagine if you get a call from the VP of your top customer informing you of an outage that you are NOT aware of?
Over the past few years Application Performance Management (APM) industry has grown like crazy – From Nagios to New Relic, from Introscope to Dynatrace the marketplace has grown exponentially.
In this section, I will provide general characteristics of a great APM tool and how it can help you support your application effectively. Also, I will provide links to popular APM tools.
Let us look at what an APM tool can buy you.
Coming up: Introduction to APM: Benefits of APM