While Unix/Linux is the most popular OS for hosting enterprise java applications, there are still significant amount of applications deployed on Windows Platform. If your application is running on a Windows box, you ought to know how to get around Windows in order to support your application effectively.
In this piece, I’m going to share with you 10 tricks every Java Developer should know. I tested these in Windows 2008 R2. But it should work on most Windows flavors. Let’s get right to it.
1. Find the full command line of your java application
In Unix/Linux, if you need to see the full command line of your application, you can simply use ‘ps –ef’. For example,
ps –ef | grep <my application>
Alas! There is no ‘ps’ in windows. So, how do you do this? Say hello to Windows Task Manager.
Just right click on the task bar and open ‘Task Manager’
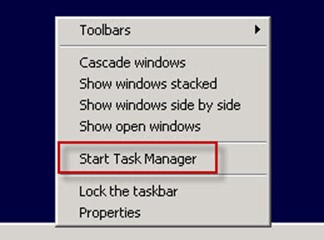
Go to ‘Processes’ tab. You will see the list of processes running on the system.
Now, by default Windows Task manager will NOT show the full command line. So, you will have to add the option by clicking on ‘View -> Add columns’
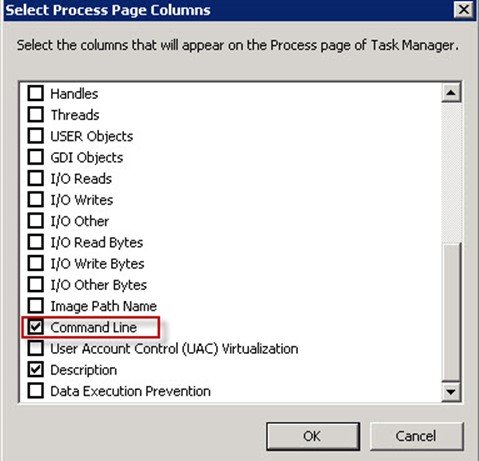
Bam! Now you will see the entire command line of your java application in the ‘command line’ column of your java process. For example, you can see the –Xms and –Xmx parameters which define the minimum and maximum java heap size.
Note: If you don’t see your java process, but know for sure that the application is running, there is a chance that you don’t have access to view the processes in the Task Manager. Try checking ‘Show processes from all users’ check box that is found at the bottom left side of the Task Manager.
2. Check if Windows is running out of resources such as CPU/Memory
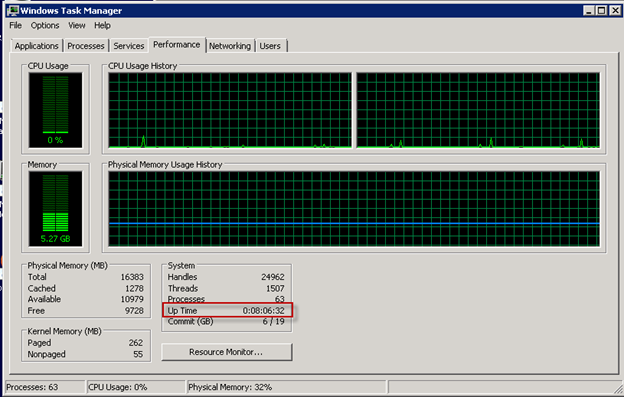
If your application is very slow in responding, there is a possibility that Windows (host operating system) is running out of resources such as CPU and Memory. How do you verify if you have enough CPU/Memory left on the host? This is one of the easiest things to check but a very crucial one. If the OS is at 100% CPU, no matter what you do, things will be slow. Checking this is very straight forward. Crank up the mighty Windows Task Manager again and go to Performance tab
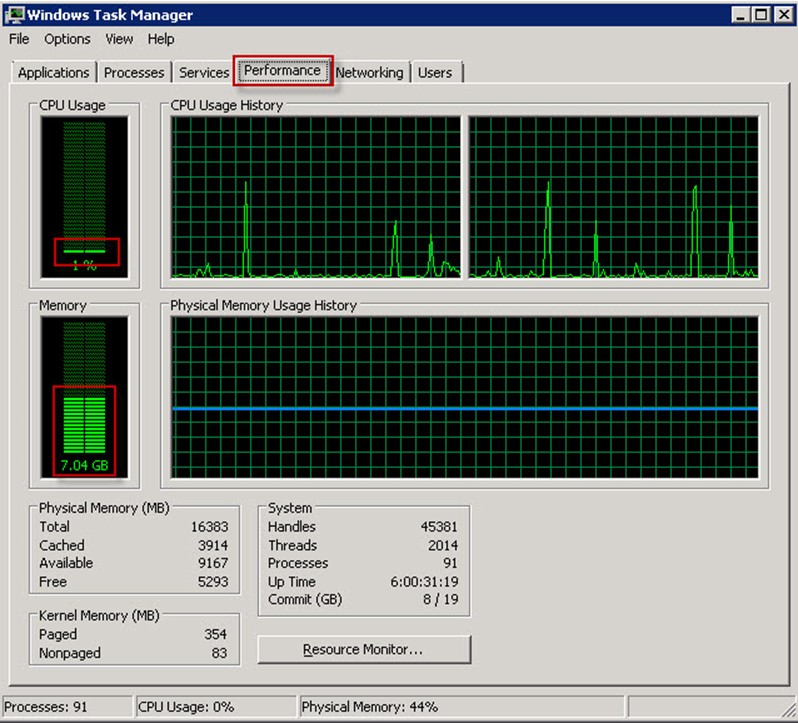
Note the CPU and Memory utilization. You don’t want either of these hitting the max. The above image indicates a very health system.
3. Take a thread dump of a running java process
Thread dumps are extremely useful when troubleshooting slow or hanging applications. A Thread dump is a text file that shows a snapshot of what is running inside the JVM. You would typically want to take few Thread dumps at 20-30 seconds intervals. This is to check if a given thread (based on the thread id) is executing the same method over multiple Thread dumps (thus revealing where the code is stuck).
To take a thread dump, first you need find the Process id of your java process. Use Windows Task manager, go to ‘processes’ tab to locate your java process and get the process id. If the process id column does not show up, you will have to click on ‘View -> Add Columns’ and select PID.
The command to create thread dump is jstack which is part of JDK.
Jstack –l <pid>
Note that you may get an error like the following when you run it.
Not enough storage is available to process this command
This means you do not have access to run this command. You will need to have your Systems Administrator run it. Or you can try psexec, which is a free windows tool that lets you run commands as super user by using the –s flag. For example
Psexec –s jstack –l <pid>
If you want to store the output in a file, simply redirect this to a file.
Psexec –s jstack –l <pid> > c:\mydir\stack.txt
Tip: What do you look for in a Thread dump? Look for Threads that are ‘runnable’. These are the threads that are currently executing. Look at the stack trace to see which line of code is being executed.
4. Take a Heap Dump of a running java process
Heap Dumps are binary files that contain a snapshot of the entire JVM Heap. You will typically need to generate a heap dump when dealing with OutOfMemory Errors and need to find out the objects that are filling up memory. You have free tools to parse and visualize a Heap Dump (for example Eclipse Memory Analyzer)
To take a Heap dump, just like how we took Thread dump, find out the process id, then use the following command
Psexec –s “C:\program files\java\jdk1.6.0_24\bin\jmap.exe” –dump:format=b,file;c:\temp\heapdump.hprof <pid>
Note: Make sure you have sufficient disk space to generate the heap dump. The heap dump could be as big as the max heap size.
Tip: You can find out more about using Eclipse Memory Analyzer in my other article Troubleshooting GC: Eclipse Memory Analyzer (MAT)
5. Find out the processes that have certain file(s)/folder(s) opened
Say you are trying to delete a file/folder but Windows throws this annoying pop up (The action can’t be completed because the folder of file in it is open in another program)
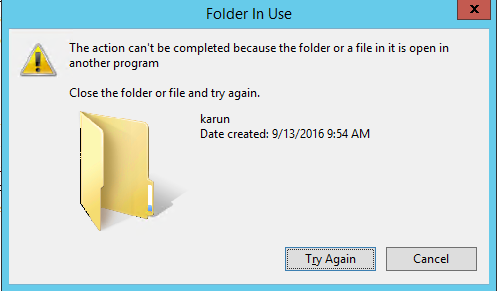
(In the example above, I was trying to rename d:\temp\karun but Windows won’t let me)
You have made sure you have stopped all the applications/services that you think are involved. But still you get the above message. How frustrating!
The easiest way to find the process(s) holding on to a file/folder is to use one of the most powerful (yet underutilized) tools – Process Explorer. You can download Process Explorer from Technet.
Once downloaded and fired up, all you have to do is Press Ctrl F for searching and enter the file/folder name and voila, it will show the processes holding on to the file/folder.
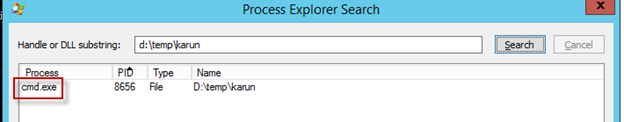
This indicates that I have the folder opened in a command prompt. So, I’ll have to hunt down and close it. You could double click to get lot more details about the process, and perhaps kill it from Process Explorer too.
Note: Process Explorer is very powerfull tool and has weath of information about the processes. I have a separate article on Process Explorer that you may want to check it out – A free life-saving Windows tool you never knew existed
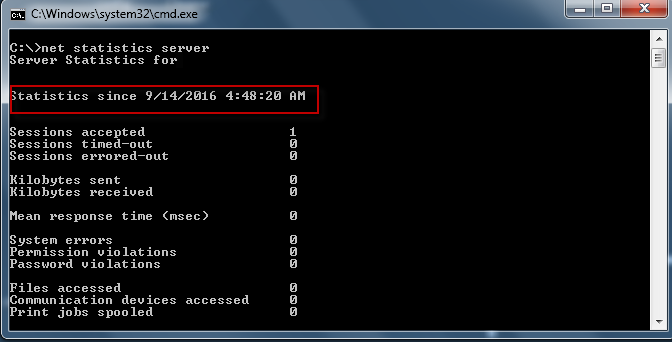
6. Find out when the server was rebooted last time
uptime is one of the most frequenly used commands in Unix. The output of this command shows (in addition to the load), how long the server has been up. It is very useful if you need to find out when the server was rebooted last time. In Windows world, it is surprisingly little (just a little) more extra work to get this information.
You can use the command net statistics server.
Another was is to use the Task Manager. Right click on the task bar and select Task Manager. Under performance tab, you will see the uptime information.
7. How to find out which Domain groups I belong to?
At times you will want to find out which domain groups you belong to. For example, if an Application is using Single Sign on with Active directory, you will need to know the group information to diagnose authentication issues.
You can use the net command as follows
net user <your user name> /domain
The output actually has several useful bits of information. You will want to scroll down and look at Local Group Memberships (applies only to this machine) and Global Group Memberships (applies in the entire network)
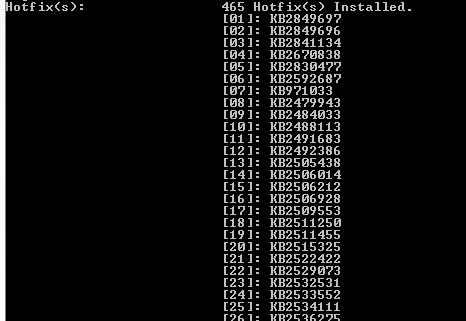
8. How to find out the Windows OS patching level?
If you application behaves weirdly and you are hunting for clues, one of the places you will look is to make sure the OS has all patches necessary (by the way, if you are at this stage, you are really dealing with a nasty problem. Nevertheless you must be able to determine the patches installed)
You can use the mighty systeminfo command.
Open a command prompt and just execute systeminfo command. Among the wealth of information this command outputs (such as system model, memory and processor information), it shows the Hotfixes installed.
Note that the command might take couple of minutes to execute. So, be patient.
9. Use robocopy to copy files
Let’s say you want to make a replica of a directory. For smaller directories, you can simply use Windows Explorer to drag/drop or Ctrl-C/Ctrl-V. However for larger directories (say several giga bytes), especially If you are copying across network, you will need a more robust copy command. Say hello to robocopy.
The advantages of robocopy are the many.
- Exclude file/folder from copying
- Restart a failed copy from the place it left off
- Delete files that are no longer in source
- Log the progress. This is valuable as you will have record of any failures. It also shows the statistics of the copy (such as number of files/folders copied and the sizes) at the end of the command.
To make a copy of a directory, use the following robocopy command
robocopy <source> <destination> /E /Log:robocpy.log
/E copies empty directories as well.
Note: There is a /MIR option that you can use with robocopy which is supposed to mirror the source directory. This command is dangerous as it can delete files in the destination in order to make it look identical to source. Use it if you absolutely know that’s what you want.
10. How to find out which files/folders are taking up space
If the disk file system fills up (C:\, D:\ etc), you will need to act swiftly to find out what is eating up the disk space and get rid of them. Note that some applications behave erroneously when the file system it runs on fills up. And on top of that, you may lose valuable logging information as the application cannot write any log due to the space issue.
One shortcut to find huge files (like core dumps), is to use Windows Search feature. Open Windows Explorer and navigate to the directory you think is the root cause. In the search window, type size:gigantic

That’s it. All the files that are larger than 128 MB will be revealed.
In order to find the folders that are huge, the best way is to use the free tool space sniffer. Try it out.
There you have it folks. Being well versed with the host operating system will help you become better at responding to Application issues. If your application is running on Windows, the 10 tricks above will take you a long way.
If you want to get further information or clarification, please let me know. Also, please don’t forget to ‘like’ and share with others.
Good luck.