≡ Menu

Oracle

IBM has given us a great tool that we can use to analyze verbose GC files literally in seconds. I’m not kidding. All you have to do is generate verbose GC logs for few hours and feed the file to this tool and Bingo; it analyzes the file and tells you what you need to know. Let’s see this tool in action.

Downloading IBM Pattern Modeling and Analysis Tool for Java Garbage Collector:

https://www.ibm.com/developerworks/community/groups/service/html/communityview?communityUuid=22d56091-3a7b-4497-b36e-634b51838e11

Click on the ‘download’ link at the bottom of the page. You will get a jar file named “ga<version>.jar”.

For example, ga456.jar.

Invoking IBM PMAT:

Read More

Troubleshooting GC: VisualVM

VisualVM is a free monitoring tool for the JVM. It is much more feature rich than Jconsole. It comes built in on the Oracle JDKs. You can also download a standalone version from visualvm.java.net.

Invoking visualvm:

The tool ‘jvisualvm’ is located in bin directory under ‘JDK Home’.

Jvisualvm

visualvm4

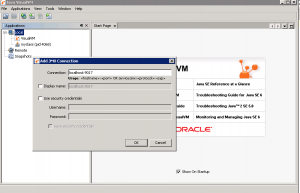
Note, similar to jconsole, if you are running visualvm with the same user id as the application, the application will appear under ‘Local’ and you can begin monitoring right away. However, if that is notthe case, you must first enable JMX remote management by adding the following parameters to the Java command line.

Read More

Troubleshooting GC: Using Jconsole

One of the built-in tools that can be used to view the memory usage graphically is jconsole. It comes with JDK. Jconsole uses JMX (Java Management Extension) to pull several vital stats from the running Java application. While jconsole may seem little outdated (and it is) it is still valuable if you want a quick GUI to view JVM stats

How to invoke Jconsole ?

Read More

So you enabled verbose GC logs and obtained the logs. Congratulations. You have done one of the most important steps in troubleshooting JVM memory issues. But merely having the log does not do any good. You need to analyze and determine if there is a smoking gun. Here is how to do it.

1. First make sure you collect the logs for at least few hours. Longer the better.

2. Open the log file in a text editor.

3. You are primarily looking for two things

a. Is the GC happening very frequently?

b. Is each GC cycle taking long time?

Read More

Troubleshooting GC: Using Verbose GC logs

If you have to choose only one tool to troubleshoot Java memory related issues, you must choose the ‘verbose gc logs’. Verbose GC log has so much information that you can diagnose almost all types of memory issues just by carefully reviewing the data in this file. It is such a valuable tool.

What’s more? The load exerted on the JVM due to verbose GC logging is virtually nothing. So, don’t skimp on enabling verbose gc logs when you need to.

What exactly do the verbose GC logs reveal?

Read More

Troubleshooting GC: Native memory issues

If you think you will never run into out of Memory error because your code is leak proof and your application server is rock solid, think again. Your application can run out of what eludes most developers and Systems Administrators – Native memory.

To put it blunt, Native memory is the memory used by JVM itself for its internal low-level tasks (for example file handles) and the memory used by any native code (such as a C library within the JVM).

What are the symptoms of native memory issues?

1. Unexpected application errors

2. One of the following error message in the log file

a. java.lang.OutOfMemoryError:Detail Message: request <size> bytes for <reason>. Out of swap space?

b. java.lang.OutOfMemoryError:Detail Message: <reason> <stack trace> (Native method)

Note that the errors above are for Oracle HotSpot. The error varies by the JVM vendor.

What causes native memory issue?

Note that the JVM is just a process as far as OS is concerned and hence it is subject to all resource restrictions that the OS poses. Here are some of the major causes of native memory issues

1. Application code issue where fault code creates tons of low level elements (such as File handles,network sockets etc).

2. Third party library code issue (for example C libraries) that suffer from memory leaks

How to prevent native memory issue?

There is not a lot you can do to prevent a native memory issue as these issues are totally unexpected.

But you can try the following

1. Ensure the third party native libraries you use are correct versions and for the appropriate OS and architecture

2. Ensure the application code does not leave lingering network or file handles.

One useful way to determine if you have native memory issue is to check the ‘process size’ of the JVM viewed using operation system tools (for example ‘top’ in Unix). This process size will include Heap and native memory used.

Moving on, let us explore various troubleshooting tools available to aid you with Memory issues

Coming up: Troubleshooting GC: Using Verbose GC logs

Previous: Troubleshooting GC: Excessive Garbage Collection
Troubleshooting GC: Heap Fragmentation

OutOfMemory error can occur due to fragmented heap. This issue is not as common as the heap exhaustion but it is a deadly issue regardless.

What are the symptoms of Heap Fragmentation ?

1. Java.lang.OutOfMemory errors in the Application log file
2. Application is not responsive or extremely slow
3. Unexpected errors in user experience

What causes Heap Fragmentation ?

Read More

Troubleshooting GC: Heap Exhaustion

When your application has used up the entire allocated heap (-Xmx) and still needs more, you run into the classic OutOfMemory error. There is simply no more memory available for your application.

What are the symptoms for Heap Exhaustion?

1.    Application is not responsive or extremely slow
2.    Java.lang.OutOfMemory error in the Application log file
3.    Possible Heap Dump file if the Application Server that is running your application is configured to do so

What causes Heap Exhaustion?

Read More

Troubleshooting GC: Various GC algorithms

GC algorithms/collectors define how GC is expected to behave at run time. There are various Collectors that you can use depending on your need. Note that the collectors vary greatly by the implementation of the JVM. This document addresses Oracle Hotspot JVM.

Note: Unless you explicitly specify a GC collector in the JVM command line, JVM selects the best collector to use based on various factors such as the hardware, platform etc

1. Serial Collector

Simplest. It uses just one thread to perform the GC operation. So, it is suited for single processor machines (are there any still left ?).

Read More

Troubleshooting GC: What is GC and how it works – Part 2

Generational heap:

The heap space is primarily divided into two segments as follows:

1. Nursery or Young generation (or Eden)

2. Old or Tenured generation

(There are other segments, and they vary by the JVM vendor. But for the most part understanding the above two segments is enough to troubleshoot GC issues)

As your application runs, the new objects are created in young generation. When the young generation is about to fill up, GC runs what is known as a ‘minor‘ collection and reclaims memory from unused objects in young generation. While at it, the minor collection also moves ‘long lived’ objects to ‘old’ generation. A ‘major‘ collection (a.k.a Full GC), which is invoked when there is serious unmet demand for memory, sweeps through the entire heap to reclaim memory.

Read More