by Karun Subramanian
on July 30, 2016
A Java application is launched with the java command which starts a JVM and runs the application. As an Application support engineer, there are few basic operations that you will typically perform on the JVM. Here are they:
Starting JVM:
Starting the JVM simply means starting the Java application. A Java application is started using the java command.
For example:
java HelloWorld
java is the command
HelloWorld is the classfile without the .class extension
Note: Don’t use the .class extension in the java command. If you do, you will get an error
[ec2-user@java]$ java HelloWorld.class

Error: Could not find or load main class HelloWorld.class
There are numerous command line options for the java command. Here are some of the main ones you need to know.
Read More
by Karun Subramanian
on July 25, 2016
As an Application Support Engineer, you will invariably end up managing Java based applications. JVM (Java Virtual Machine) is the all-important process that runs the Java Application you are going to manage (which can be either custom developed by your development group, or a commercial off the shelf product). It is imperative that you have a very good understanding of how JVM works.
Note: Some of the material in this section will be very basic that experienced Administrators can choose to skip.
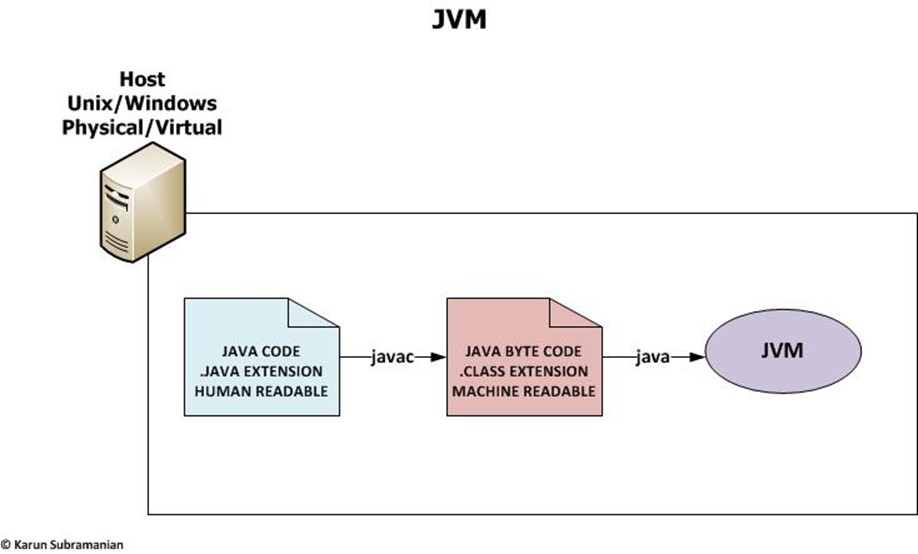
At a high level:
- Java is a high level programming language (this is the code). A java program is a text file(s) that is/are human readable.
- Javac is a compiler program that compiles the human readable java code in to machine readable byte code.
- JVM (Java virtual machine) is a process that runs the java byte code. It is an implementation of specification created by Sun/Oracle.
Read More
by Karun Subramanian
on July 4, 2016
Java Heap is a labyrinth. You can spend hours or even days analyzing a heap dump from a production Java application. Heap is where all the objects created by your application live. And even in a relatively simple application, there could be hundreds of thousands of objects created. When dealing with Java memory leak, you know you are looking for one the following (or both):
- Excessive number of objects of certain class
- Objects with unusually large size
Fortunately, Appdynamics provides a feature using which you can easily reveal both of the above cases. Let’s get right to it.
- In AppDynamics Controller UI, locate the Node that you want to troubleshoot and click on ‘Memory’ tab
Read More
by Karun Subramanian
on July 4, 2016
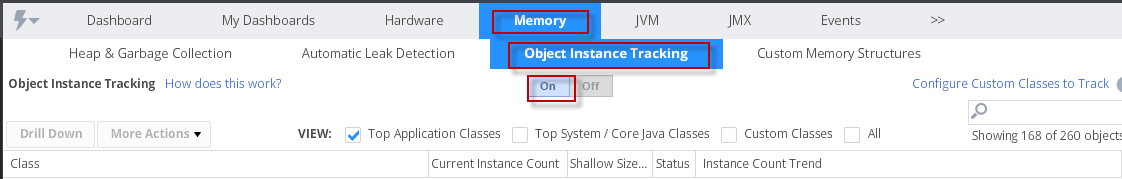
In this part, let’s explore AppDynamics facilities for diagnosing Memory Leaks. AppDynamics provides two powerful tools to hunt down memory leaks.
- Automatic Leak Detection
- Objet Instance Tracking
Automatic Leak Detection
With Automatic Leak Detection enabled, Appdyanmics can capture objects that live longer than usual period – i.e long lived Collection objects that simply won’t get garbage collected. If your application is leaking memory, it is definitely one of these long-living, never-dying objects that cause the leak. Use the following procedure to make use of this tool.
Read More
by Karun Subramanian
on May 11, 2016
Troubleshooting JVM memory issues can be daunting, but you if you don’t fix it, it can kill your application and possibly your face in front of your customers. There is good news though. With any modern APM tool, you virtually get an X-Ray vision to this labyrinth named Java Heap.
In this blog post, I’ll show you how to use AppDynamics to troubleshoot Java memory issues.
AppDynamics is one of the leading APM vendors in the market, providing tons of useful tools ranging from Hardware monitoring to End user experience monitoring to operational data analytics (Actually it can be quite overwhelming. If you don’t know what exactly you are looking for in the tool, you can go in circles. But don’t worry, I can help).
There are three major areas where AppDynamics can help in regards to Java memory troubleshooting.
Read More
by Karun Subramanian
on February 12, 2016
Java memory leaks can be deadly, and difficult to troubleshoot. Are you one of those shops where you restart your Application Servers at regular intervals (weekly, daily or more frequently)? It is pathetic, is it not? Wait a minute, gone are the days where we had 128 MB memory on servers. We have several giga bytes of memory on servers, don’t we? Why do we still run into memory issues? Good question. But sad truth is there are several reasons why Memory leak is not something that will go away. All you can do is to prepare yourself. And that’s what this article is about. Let’s dive into 10 things you need to know about Java memory leak.
1. Java Heap Memory leak is different from Native Memory leak
Java heap is where the objects created by your application live. The maximum heap is determined by the –Xmx flag of the Java command line that starts the application. If you write code that leaks memory, there is where it will blow up.
Read More
by Karun Subramanian
on January 6, 2016
Agent is a vital part of Appdynamics framework. It is the agent that acts like a workhorse to pull metrics from the Application and push it to the Controller. Agent is a piece of software that is installed ON your application. The only function of the agent is to pull the monitoring metrics and send them to the AppDynamics Controller where the data is crunched and made available via the Controller UI. Note that there is NO need of a code change in your application. There is however a setup/configuration change required depending on the platform. In this article, I will explain how to instrument a Java Application.
Read More
by Karun Subramanian
on August 9, 2015
Question:
How do you change the default Admin password on Jboss Community Edition ?
Answer:
Update the following file:
<JBOSS HOME>/server/<profile>/conf/props/jmx-console-users.properties
The format of the file is:
user=password
for example,
admin=Chr!stMa5123
You do NOT have to restart Jboss for this change to take effect.
by Karun Subramanian
on June 20, 2015
So, what can an APM tool buy you? Setting aside the hypothetical ‘Peace of mind’ marketing pitch, let me show you how exactly an APM tool can help you support your Application effectively
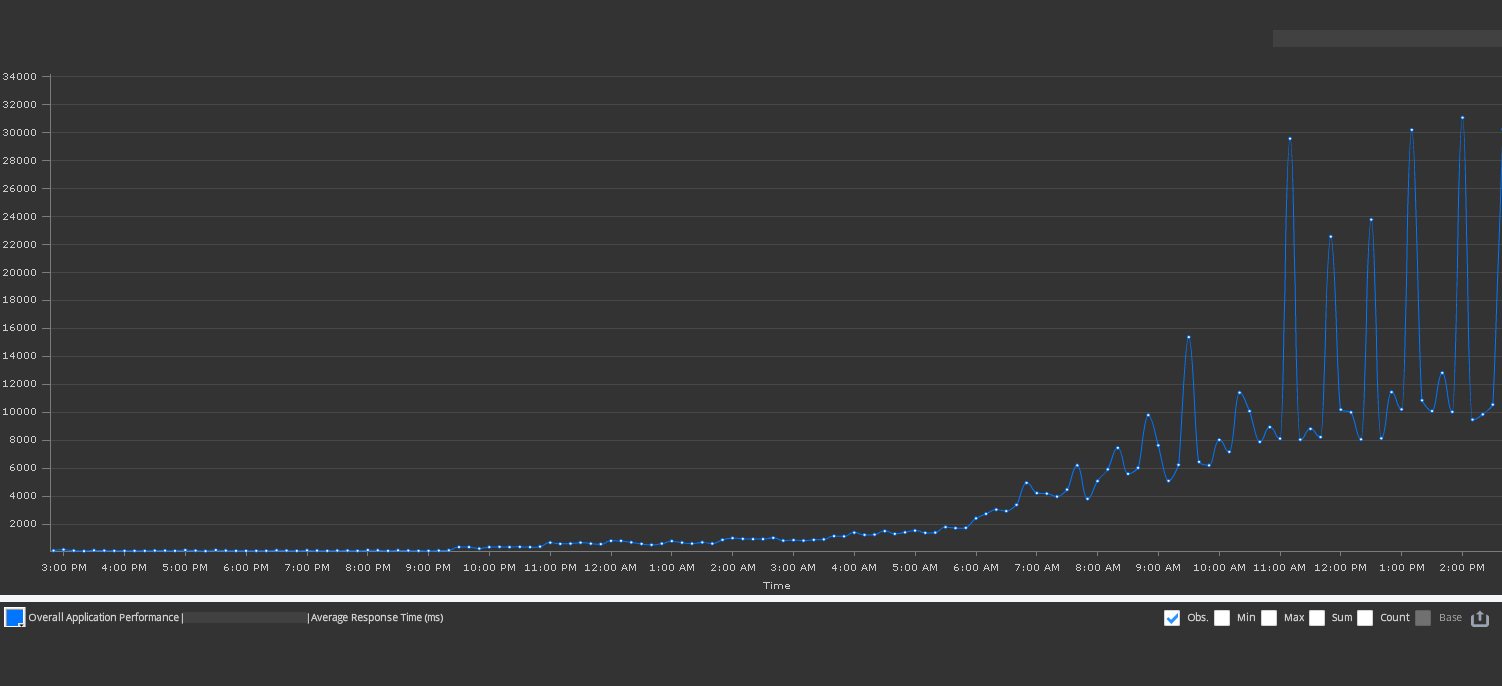
1. Historic Monitoring of Key Metrics
APM tool can record the monitoring metrics which are invaluable in troubleshooting. For example, take a look at the ‘response time’ graph of a particular application. You can readily see that the application suffers during business hours.
Read More
by Karun Subramanian
on June 20, 2015
Back in the 90s when I was working as a Solaris/HP-UX Administrator, all I needed was two or three commands to figure out what was wrong with a particular Server or Application. I will just glance at ‘vmstat’, ‘iostat’ and ‘top’ for a minute or two and the problem will reveal itself clearly. While those command still prove valuable at a certain level, in order to answer ‘Why is the application slow’ you need much more than just few OS commands.
Read More