In your Application support/Developer Journey, you will definitely come across a time where you will want to really dive into the Java heap and see what is filling up the memory. We are literally talking about all those java objects that are in the heap. Mind you this can run into hundreds of millions in numbers. How do you get an insight into what is in the Heap? By analyzing a Heap dump. And how do you analyze the heap dump? By using the all-powerful Eclipse Memory Analyzer (MAT)
Before we begin using MAT, how do you capture heap dump?
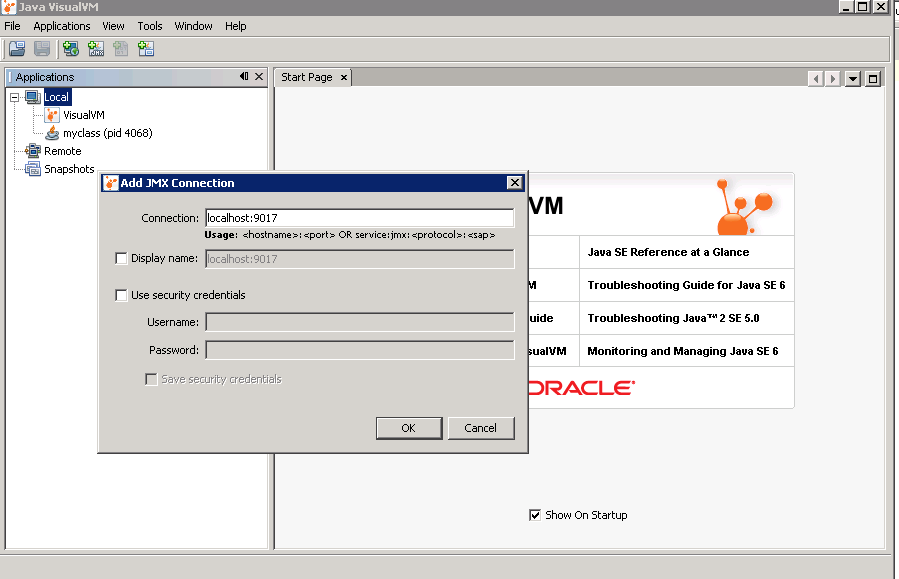
Now, this varies from application to application. For example, if you are running IBM WebSphere, you could use a wsadmin script to invoke heap dump. Earlier you saw visualvm can create a heap dump for you through the visualvm interface. You can also use the command ‘jmap’ to create heap dump. Further you can configure the Application server to automatically perform a heap dump when an ‘out of memory’ error is encountered (XX:-HeapDumpOnOutOfMemoryError). Note that this option is verified to work on Oracle Hotspot JVM only.
Downloading Eclipse MAT: