When your application server is hung for whatever reason, the end-user experience takes a hit and your reputation as an Application Support engineer tanks. While the most important activity is to restore service, which may involve recycling your application server, you must act swiftly to collect as much diagnostics information as possible before you do that. In my experience, obtaining Java Heap dump and Thread dump are extremely valuable in such cases. Here is how you obtain these dumps for a JBoss Application server. As a matter of fact, this method will equally work for any JEE Application server (even though Application Servers like IBM WebSphere provide utilities/commands to do this)
Here we go:
1. Java Thread dump
Work enters Application Server through Threads. Thread dump shows the snapshot of all threads and their stack traces. This means you clearly see what the Application Server was working on when you took the thread dump.
Important note: Always take at least 3 thread dumps at 10 seconds interval. This is to identify if a particular thread is at the same work in all thread dumps, which will mean that thread is hung up for some reason – may be it is waiting for a backend resource to respond.
You can use the ‘jstack‘ command that comes with the JDK to obtain Java thread dump.
a. Log on to Application server
b. Identify the process id of your application server
Windows: Using ‘Task Manager’
Unix/Linux: Using ‘ps -ef’ command
Note: If you don’t have ‘psexec‘, you can download it from Windows Sysinternals website. For Unix/Linux systems, you don’t need ‘psexec’, just run the jstack command directly.
The process id in the above command is 5488 (It is of a Jboss Application Server EAP 5.3.1). The thread dump gets stored in d:\temp\javacore.txt
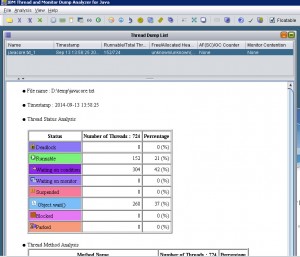
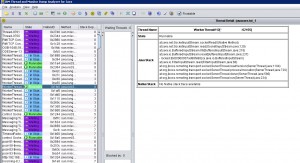
For analyzing thread dumps, there are lot of tools. I prefer the most sophisticated tool – notepad. No kidding. Typically, I just look for the ‘RUNNABLE’ threads and I can generally make my way through that. But if you really need to use a tool, I recommend IBM’s ‘Thread and Monitor Dump Analyzer for Java’. It is pretty powerful. See the screen shots below.
Note: You can also use the Jboss JMX console to obtain thread dump. Once in JMX Console, navigate to ‘jboss.system type=ServerInfo’. Scroll down and click the ‘invoke’ button for the operation ‘listThreadDump’
Now, let’s move on to Heap dump.
2. Java Heap dump:
Java heap dump has the snapshot of the Java heap at the time of the dump. It is extremely valuable in troubleshooting ‘OutOfMemory’ errors. For example, if the biggest object in the Heap generally points to the leak suspect. When you provide the object name to the Application Developer, you give him a good starting point on analyzing the issue from his perspective.
You can use the ‘jmap’ command that comes with the JDK to obtain the heap dump.
Note: If you don’t have ‘psexec’, you can download it from Microsoft website. For Unix/Linux systems, you don’t need ‘psexec’, just run the jmap command directly.
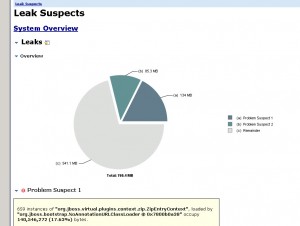
The best tool for analyzing Heap dumps is Eclipse Memory Analyzer, a free download. Once started, I typically look for couple of things in the heap dump
1. Biggest Objects
2. Leak suspect suggested by Eclipse Memory Analyzer
One thing note is, when you provide the object names to the developers, try to obtain the objects that reflect the application code – for example: com.mycompany.mayapp.Orders instead of objects that reflect system/application server library code – for example: org.hibernate.impl.SessionFactoryImpl. It may not mean much to developers. Get it ?
Just to add, don’t forget the Application Server’s standard out and standard error logs. In fact, your troubleshooting, no matter what the issue is, should start with a through review of the log files (In Jboss, it is the server.log and boot.log files).
There you have it. Hung applications can be tricky to troubleshoot. But with the right tools and diagnostic logs and dumps, it is only a matter of minutes before you zero in on the root cause. As an application support engineer, it is a great opportunity to showcase your deep understanding of the Application server and the application. Now, go ahead and show the software development team where exactly their code busted :-).
Good Luck.


